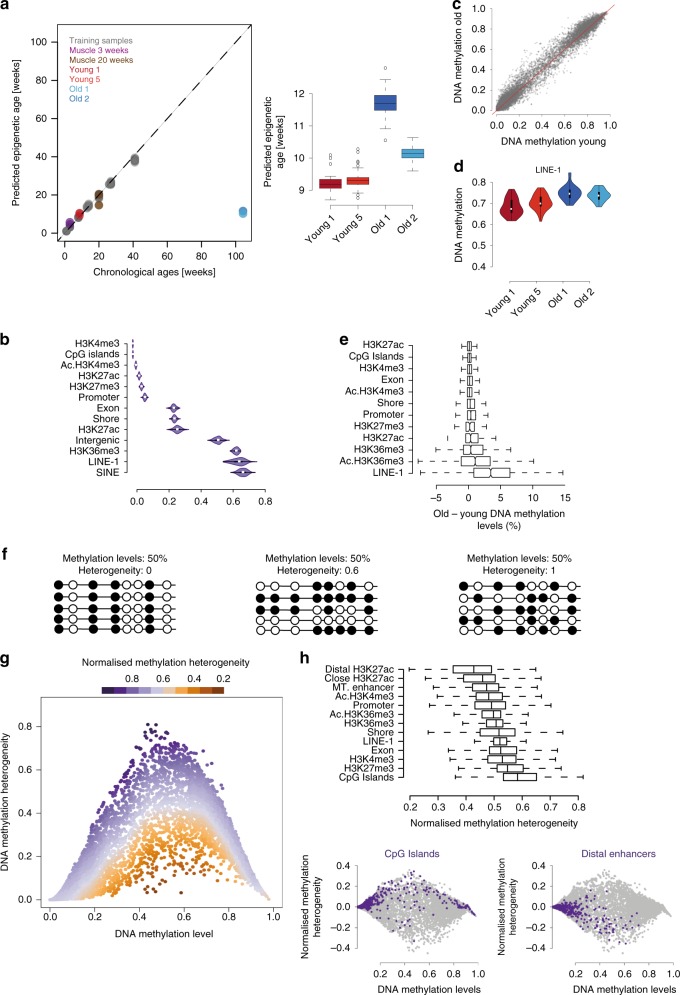
Fig. 3.
Changes in methylation levels and methylation heterogeneity. a Prediction of chronological age from a DNA methylation clock25. Left: x-axis shows the chronological age and y-axis shows the predicted epigenetic age. Grey circles indicate the training data sets. Test samples are represented in different colours: Muscle samples from Reizel et al.42 are represented in purple (3 weeks-old) and brown (20 weeks-old). Pseudo bulk muscle stem cells from young animals (6–7 weeks-old) in red and from old animals (115 weeks-old) in blue. Right: Predicted epigenetic age of different combinations of single cells, permutations = 100. For all boxplots, the box represents the interquartile range and the horizontal line in the box represents the median (n = 100). b Levels of DNA methylation per cell across different genomic regions (Chip-seq data from 2-months-old mice20,27, Ac: activated muscle stem cells). Circles inside the violin plots represent the median of the data and the boxes indicate the interquartile range. c Genome-wide mean methylation values in old and young cells. Each dot represents a genomic region. d Increase of DNA methylation with age across LINE-1 elements (P < 0.05). DNA methylation values computed per cell and individual. e Mean methylation difference between old and young cells across different genomic elements. For all boxplots, the box represents the interquartile range and the horizontal line in the box represents the median. f Examples of different distributions of DNA methylation heterogeneity at loci with similar average methylation. Empty circles represent unmethylated CpG sites and filled circles methylated CpG sites. g DNA methylation levels and DNA methylation heterogeneity. Each dot represents a genomic region from young or old cells. Colour scale represents the methylation-level normalised measure of DNA methylation heterogeneity. h Boxplot showing the normalised DNA methylation heterogeneity across different genomic elements in young cells (top). Normalised methylation heterogeneity and methylation levels across all the different genomic elements (grey) and across CpG Islands (purple) or enhancer regions (purple) in young cells (bottom). For all boxplots, the box represents the interquartile range and the horizontal line in the box represents the median

