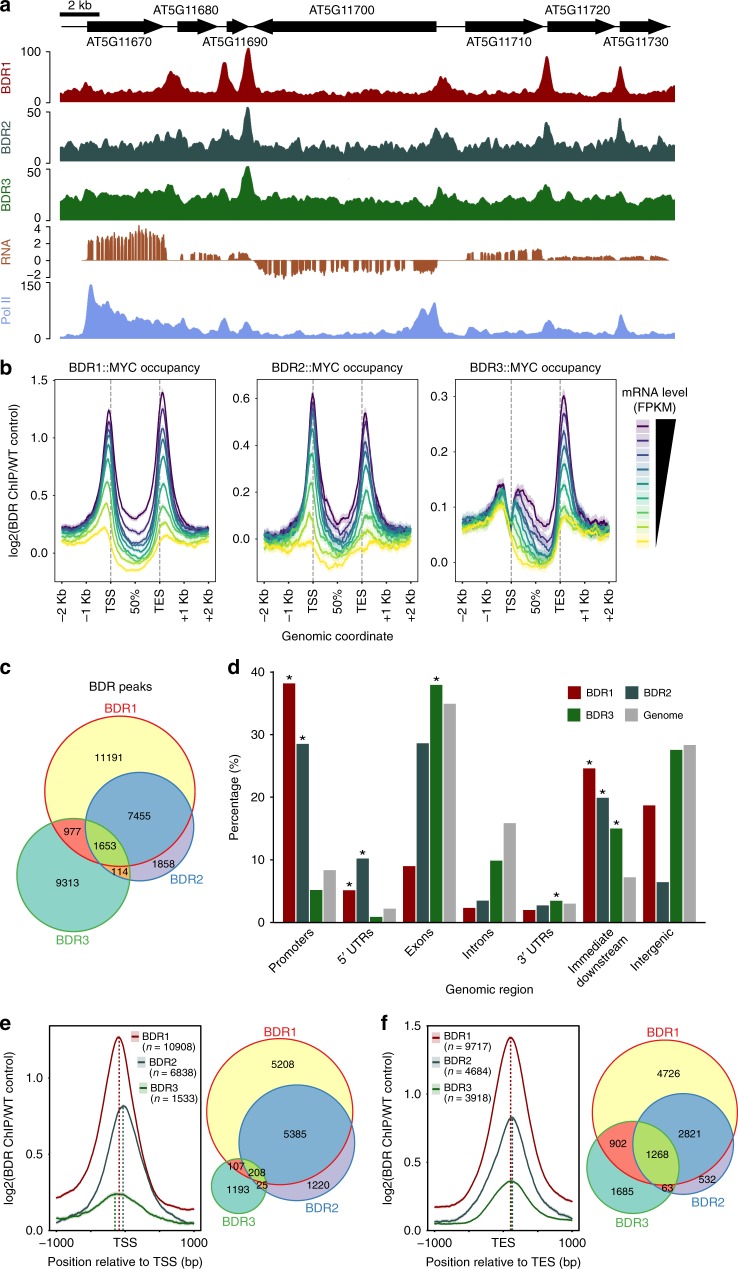
Fig. 2.
Genome-wide localization of BDR proteins. a Browser track showing intergenic enrichment of BDR1, BDR2, BDR3, and Pol II. b Metagene profiles of BDR1::MYC, BDR2::MYC, and BDR3::MYC ChIP-seq signal in nine groups of genes defined by increasing mRNA expression levels in wild type. The average BDR ChIP-seq signal for each group (line) and the associated 95% confidence interval based on a Gaussian assumption (shade) are represented. Signal in gene bodies was averaged in bins of 1% of the gene size. FPKM fragments per kilobase per million aligned fragments. c Venn diagram showing the overlap between BDR1, BDR2, and BDR3 peaks. d Distribution of BDR ChIP-seq peaks in various classes of genomic features. Promoter regions and immediate downstream regions are defined as up to 300 bp upstream from the TSS or downstream of the TES, respectively. Intergenic regions are >300 bp from any gene. Asterisks indicate a significant enrichment compared to genome-wide distributions (p < 0.002). e, f Coverage of ChIP-seq signal for BDR1, BDR2, and BDR3 around the TSS (e) and TES (f). For each protein, genes were selected that contained peak summits <300 bp from their TSS (e) or TES (f). Venn diagrams illustrate the overlap between genes with BDR1, BDR2, and BDR3 peaks at their TSS (e) or TES (f)

