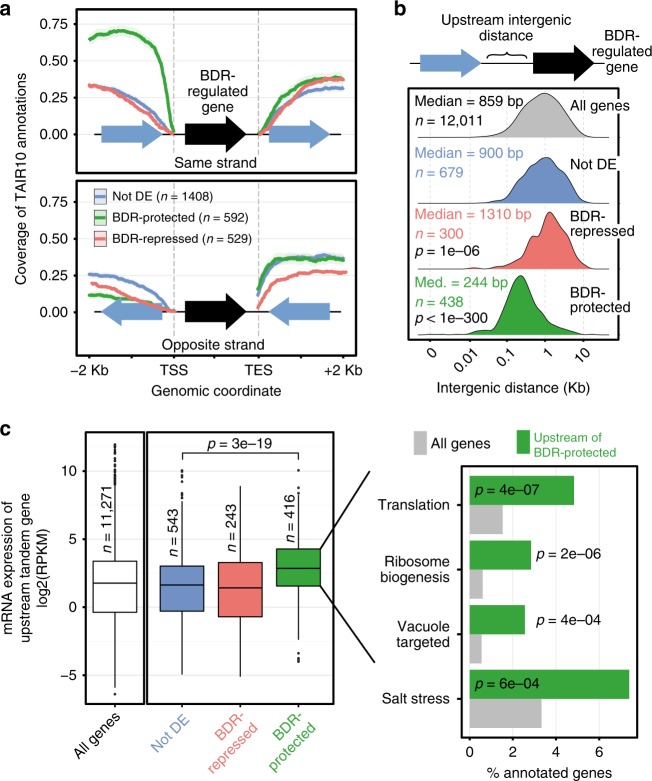
Fig. 5.
Genes positively regulated by BDR proteins tend to have highly expressed upstream neighbors on the same strand. a Fraction of BDR-regulated genes that have upstream or downstream neighbors at various orientations, within the indicated distances. b BDR-protected genes and their upstream tandem neighbors have short intergenic distances. Distribution of intergenic distances between tandem genes. Distribution differences relative to all genes were evaluated by Kolmogorov–Smirnov test with BH correction. c The upstream tandem neighbors of BDR-protected genes have relatively high expression levels. Wild-type gene expression levels for upstream tandem neighbors from the indicated groups of genes (left panel). Differences are evaluated by Mann–Whitney U test. Right panel, gene ontology analysis (goseq R package) of the upstream tandem neighbors of BDR-protected genes. Categories with p < 0.001 are shown. The centerline of the boxplot is the median. The bounds of the box are the first and third quartiles (Q1 and Q3). Whiskers represent data range but are bounded to 1.5-fold the interquartile range (Q3–Q1); points outside this range are represented individually

