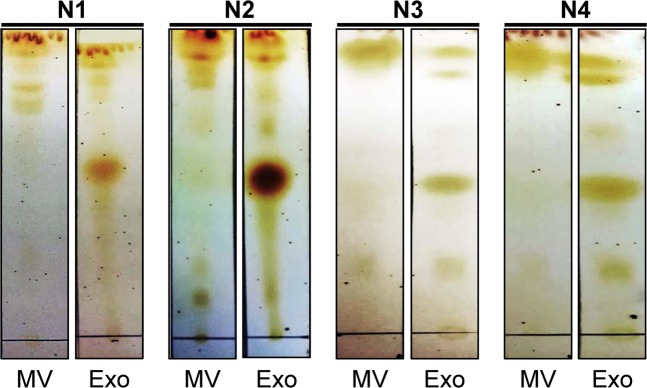
Figure 3.
Consistent and distinct TLC lipidome profiles of urinary microvesicles vs. exosomes. After isolation/purification, lipids were extracted from urinary microvesicles and exosomes and then resolved by TLC. The data showed consistent TLC band pattern of each type of these two EVs in all four independent experiments. Moreover, the TLC band pattern of lipids derived from urinary microvesicles obviously differed from those derived from urinary exosomes. The full-length images of these cropped TLC plates are provided in Supplementary Fig. S1. MV = microvesicles; Exo = exosomes.

