Fig. 4.
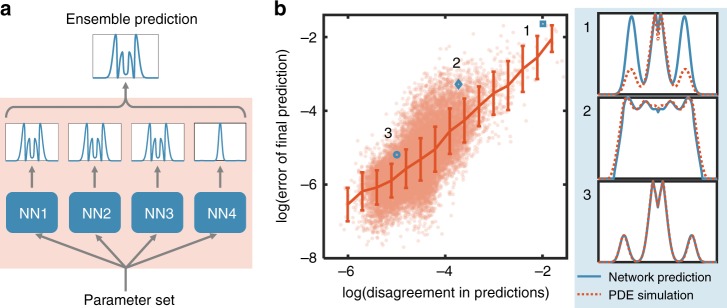
Ensemble predictions enable self-contained evaluation of the prediction accuracy. a Schematic plot of ensemble prediction. With each new parameter set (different combinations of parameters), we used several trained neural networks to predict the distribution independently. Though these networks have the same architecture, the training process has an intrinsically stochastic component due to random initialization and backpropagation. There might be multiple solutions for a certain output to be reached due to non-linearity. Despite the difference in parameterization of trainable variables (Supplementary Fig. 6a), the different neural networks trained from the same data overall make similar predictions. Based on these independent predictions, we can get a finalized prediction using a voting algorithm. b The disagreement in predictions (DP) is positively correlated with the error in prediction (EP). We calculated the disagreement in predictions (averaged RMSE between predictions from different neural networks) and error of final prediction (RMSE between final ensemble prediction and PDE simulation) for all samples in test data set (red dots). We then divided all data into 15 equally spaced bins (in log scale) and calculated the mean and standard deviation for each bin (red line). Error bar represents one standard error. The positive correlation suggests that the consensus between neural networks represents a self-contained metric for the reliability of each prediction. We showed three sample predictions with different degrees of accuracy: sample 1: DP = 0.14, EP = 0.19; sample 2: DP = 0.024, EP = 0.038; sample 3: DP = 0.0068, EP = 0.0056

