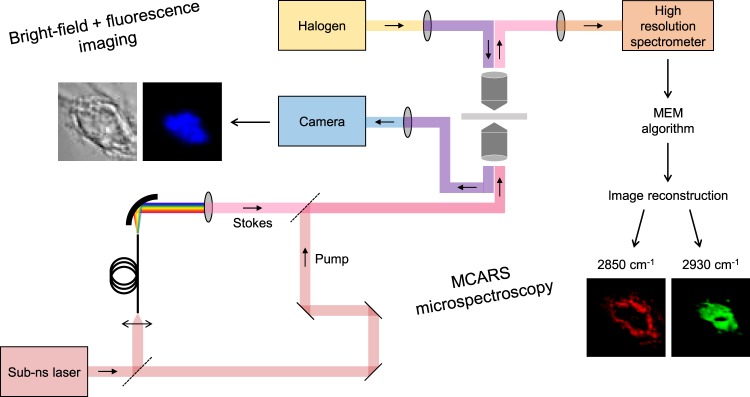
Figure 2.
Experimental and numerical methodology for the analysis of cell cultures. First, cells of interest were selected using bright-field and/or fluorescence imaging. Then selected cells were mapped by means of high spectral resolution (<1 cm−1) MCARS microspectroscopy in the 2500–3200 cm−1 range (see Methods for details of the MCARS system). Finally, the vibrational information was extracted by using MEM algorithm, and cell images were reconstructed at 2850 cm−1 (CH2 symmetric stretching) and 2930 cm−1 (CH3 symmetric stretching).

