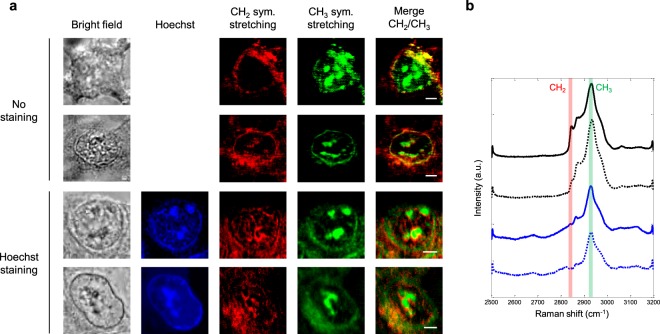
Figure 6.
Analysis of interphase (G1/S), stained and unstained, living HEK293 cells. (a) Bright-field, fluorescence and MCARS (CH2, CH3, merge) images of selected cells. MCARS images were reconstructed at 2850 cm−1 (CH2 symmetric stretching) and 2930 cm−1 (CH3 symmetric stretching). Scale bar, 5 µm. (b) Standard deviation of the vibrationally resonant CARS signal between 2500 and 3200 cm−1, computed over the whole analysis window of each cell. Spectra are plotted vertically in the same order as corresponding cells. CH2 and CH3 channels are highlighted.

