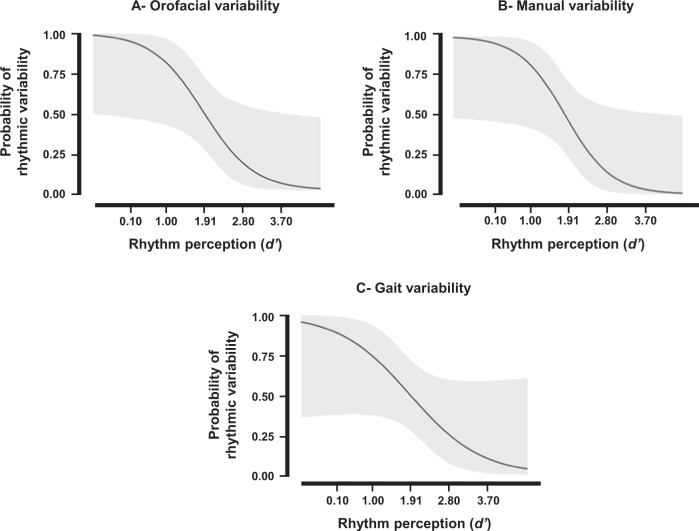
Fig. 2.
Probability curves of rhythmic variability for logistic regression models. Regression models relative to the oral diadochokinesia a, paced finger tapping b, and gait c tasks. The y-axis provides the probability for patients to display high or low rhythmic variability in each motor domain (0 = lowest variability; 1 = highest variability). The x-axis corresponds to the rhythm perception performance (d′ values). Values in bold indicate the mean ± 1SD values of rhythm perception. Light gray areas refer to the 95% confidence intervals

