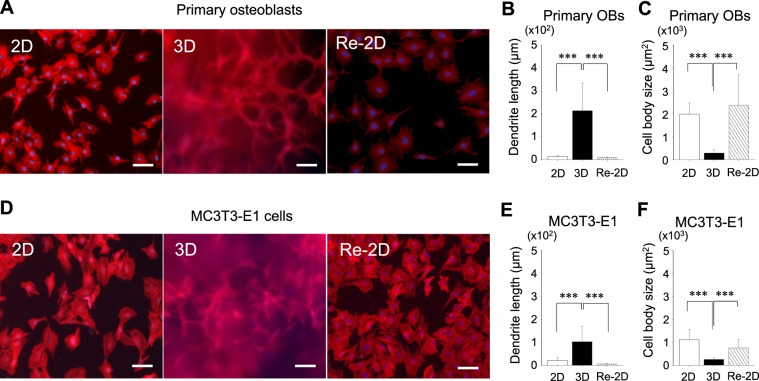
Figure 2.
Characterisation of the cell morphology. Representative fluorescent images of primary osteoblasts (A) and MC3T3-E1 cells (D) stained with DAPI for cell nuclei (blue) and rhodamine-phalloidin for actin filaments (red) (bar: 100 µm). Cells were cultured for 10 days under 2-dimensional (2D) or 3-dimensional (3D) conditions. A separate group of cells in 3D cultures for 10 days was recovered and plated back in 2D cultures for another 10 days (Re-2D). The dendrites and cell bodies of primary osteoblasts (B,C) and MC3T3-E1 cells (E,F) were morphometrically assessed and compared between 2D, 3D, and Re-2D cultures. For each culture, at least 20 cells were randomly selected and morphometrically analysed. The graphs show the mean values ± standard deviation of three independent experiments. Data were statistically analysed using a one-way ANOVA. ***p < 0.001.

