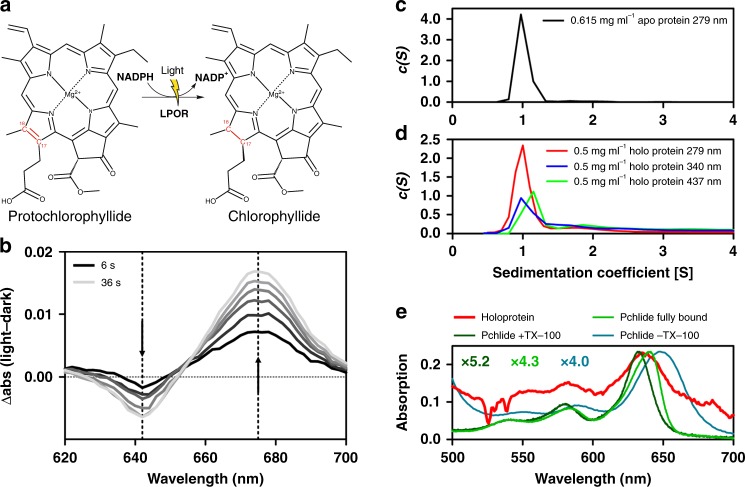
Fig. 1.
Catalyzed reaction, functionality tests and multi-wavelength analytical ultra-centrifugation of TeLPOR. a LPORs catalyze the light-dependent reduction of the C17 = C18 double bond (highlighted in red) of protochlorophyllide (Pchlide) to chlorophyllide. b Light-dark difference absorption spectra illustrate holoprotein activity. Samples were illuminated with blue light at 6 s intervals (6 to 36 s; shown in shades of grey). The decrease in the Pchlide absorption band (642 nm) and the concomitant increase of the Chlide product band (675 nm) are marked by dashed lines and the direction of the change is indicated by arrows. c Sedimentation coefficient distributions c(s) of the predominately monomeric (~1 S) 0.5 mg ml−1 apoprotein sample. d Sedimentation coefficient distributions c(s) of a 0.5 mg ml−1 holoprotein sample at either 279, 340 or 437 nm, showing the relative abundances of monomeric protein (~1S) and nearby dimer (~2S) (see also Supplementary Fig. 3c). e Absorption spectra of the holoprotein (red line) taken from the first scan at central radial position during analytical ultracentrifugation and absorption spectra of free Pchlide (3.5 µM with (dark green line) and without Triton-X100 (cyan line)), along with the absorption spectrum of fully protein bound Pchlide in reaction buffer (green line). The latter three spectra were recorded on a benchtop spectrophotometer and scaled to yield similar absorption at the Pchlide Qy-band (see scaling factors in the figure). See Supplementary Fig. 3d for full data

