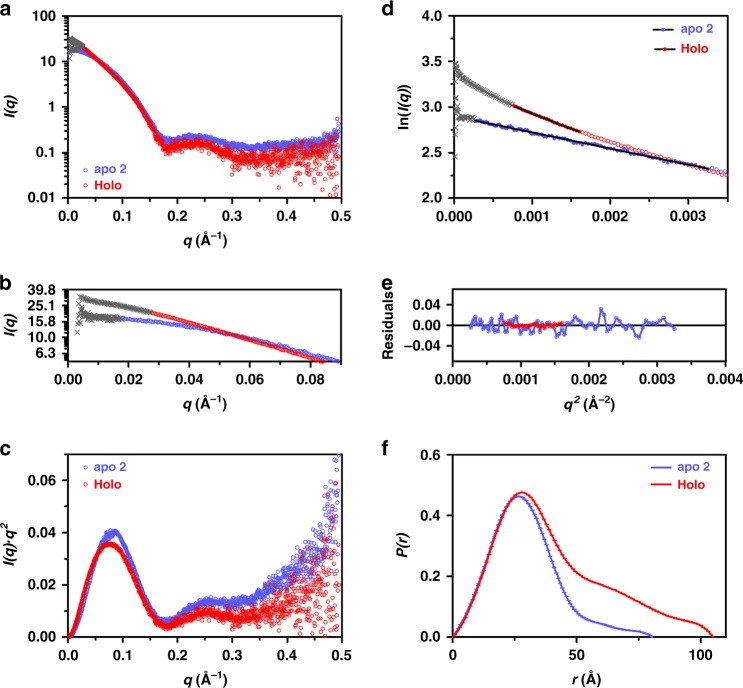
Fig. 2.
Apo and holoprotein TeLPOR SAXS data. Representative SAXS data of the TeLPOR apo- (apo 2 dataset; light blue, open circles) and holoprotein (5 mg ml−1 dataset; red, open circles)(for details see: see Supplementary Discussion Section 1.3). The full datasets of the employed concentration series are shown in Supplementary Figs. 4 and 5. a SAXS scattering curve. b Scattering curve in the low q range. c Kratky plots (I(q).q2 versus q). d Guinier plots (ln(I(q)) versus q2) and e residuals) for qRg<1.3. Open symbols indicate data beyond the Guinier region. f Pair distribution function, P(r). Data excluded from Guinier analysis in the low q range is shown as grey crosses in all plots

