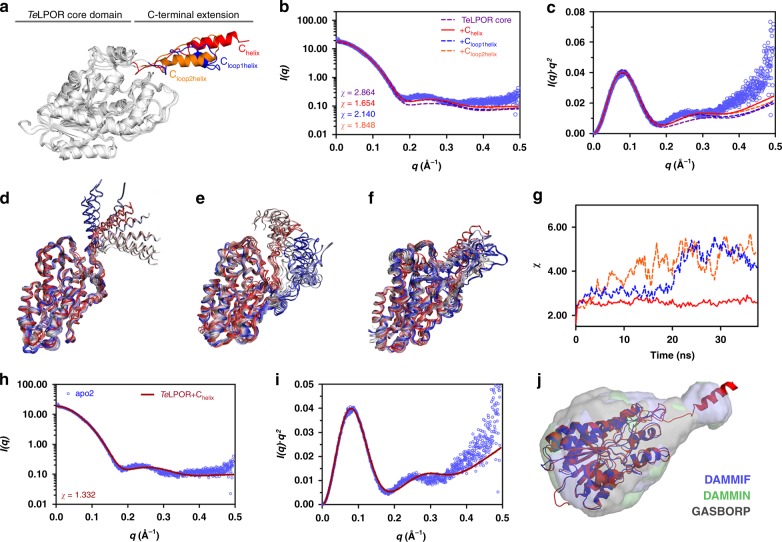
Fig. 3.
SAXS-guided modelling of the TeLPOR apoprotein monomer. a Three different, C-terminally extended TeLPOR models (TeLPOR-Chelix (red), TeLPOR-Cloop1helix (blue) and TeLPOR-Cloop2helix (orange) and CRYSOL-based model evaluation, showing b the SAXS scattering curve and c the Kratky plot (I(q).q2 versus q), with the respective theoretical scattering curve superimposed (solid and dashed lines; color coded as in b) on the experimental scattering data of the apoprotein (light blue, open circles). To enable the direct comparison between the models, no constant was subtracted during the CRYSOL fit. Superimposition of selected snapshots of the simulation trajectories of d TeLPOR-Chelix, e TeLPOR-Cloop1helix and f TeLPOR-Cloop2helix. g CRYSOL-derived χ value for the fit of the theoretical scattering curves of 150 molecular dynamics snapshots against of the experimental scattering data of the TeLPOR apoprotein (color coded as in b). h CRYSOL-based model evaluation for the best C-terminally extended TeLPOR model (TeLPOR-Chelix), showing h, the SAXS scattering curve and i the corresponding Kratky plot, with the theoretical scattering curve of the TeLPOR-Chelix model (solid dark red line) superimposed on the experimental scattering data of the apoprotein (light blue, open circles). Compared to b, the fit of the theoretical scattering curve was improved by constant subtraction, which accounts for systematic errors due to mismatched buffers. j SITUS-derived envelope function, obtained from averaged and filtered DAMMIF- (blue), DAMMIN- (green) and GASBORP (grey)-derived ab initio models (transparent surface) superimposed on the best C-terminally extended TeLPOR model (TeLPOR-Chelix, red cartoon). For comparison also the TeLPOR core domain model (blue cartoon) is shown

