Figure 1.

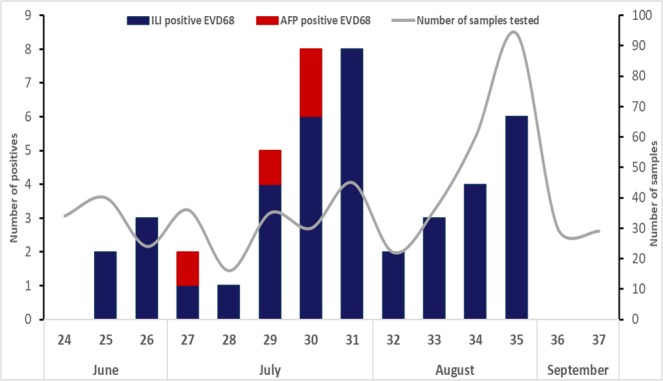
Distribution of EV-D68 in Senegal, from June to September 2016. The unbroken line represents the number of specimens collected per weeks. The shaded bars show EV-D68-positive specimens from patients with ILI (in blue) and AFP (in red).

Distribution of EV-D68 in Senegal, from June to September 2016. The unbroken line represents the number of specimens collected per weeks. The shaded bars show EV-D68-positive specimens from patients with ILI (in blue) and AFP (in red).