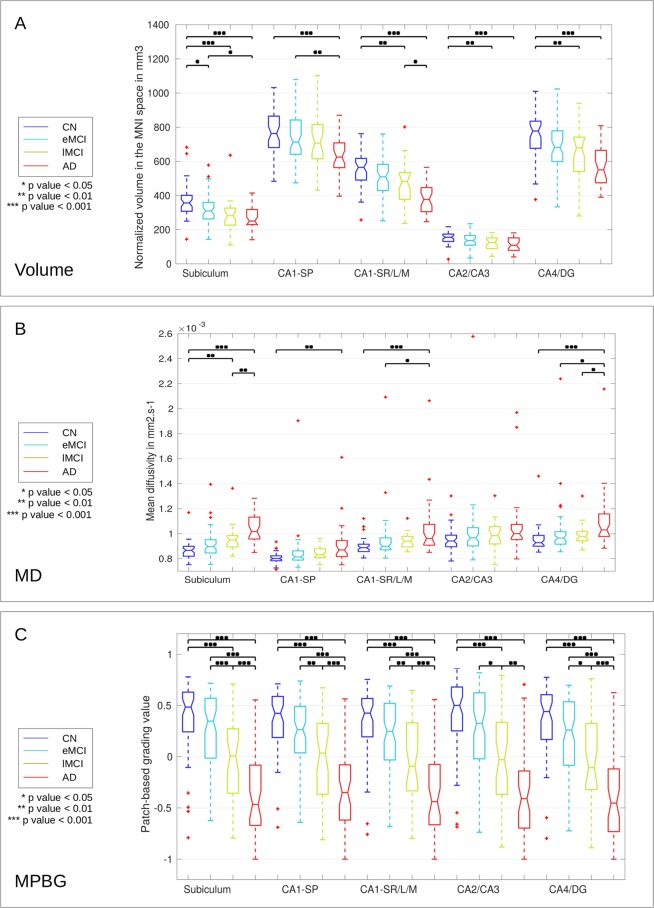
Figure 4.
Distribution of the volume (A), MD (B), and MPBG (C) for the different considered groups. The normalized volumes are provided in mm3 in the MNI space for each subfield, MD is the mean of MD values into each subfield in mm2.s−1, and MPBG is the mean patch-based grading values into each subfield. Blue, cyan, orange, and red colors represent CN, eMCI, lMCI, and AD subjects, respectively. Statistical tests have been performed with ANOVA procedure and corrected for multiple comparisons with the Bonferroni’s method. The p-values inferior to 0.05, 0.01, and 0.001 are represented with *, **, and ***, respectively.

