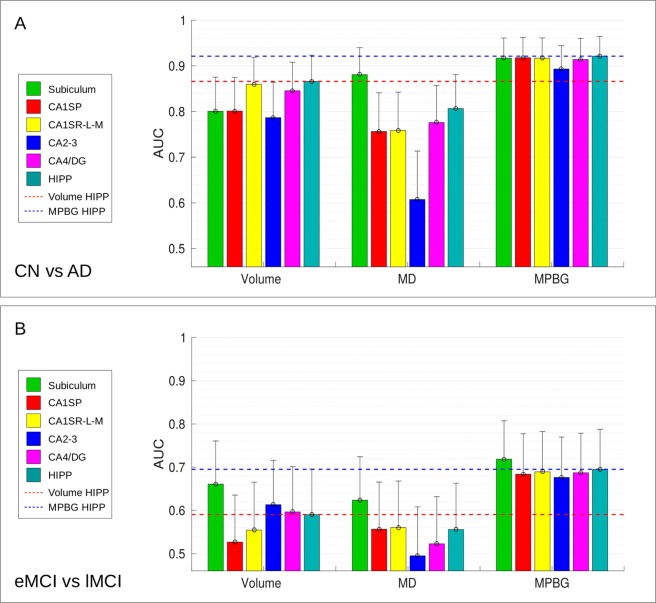
Figure 5.
AUC computed for CN versus AD (A), eMCI versus lMCI (B) comparisons with the different considered biomarkers in each hippocampal area. Results of subfields are grouped by features (i.e., the volume, the average of MD and the MPBG). Upper bounds of the confidence interval are represented with vertical bars. Whole hippocampus volume biomarker provides the best results with a mean AUC of 86.6% for CN versus AD comparison, followed by the CA1S-R-L-M volume that obtains a mean AUC of 86%. Subiculum volume provides the best results for eMCI versus lMCI with a mean AUC of 66.1%. The average of MD for subiculum obtains the best results for CN versus AD and eMCI versus lMCI with a mean AUC of 88.1% and 62.4%, respectively. Whole hippocampus MPBG obtains the best results for CN versus AD with a mean AUC of 92.1%. Subiculum MPBG obtains the best results for eMCI versus lMCI comparison with a mean AUC of 71.8%. This comparison shows that subiculum is the only biomarker providing better results than the whole hippocampus. This figure presents mean AUC and the mean confidence intervals that have been computed for each iteration of the stratified 5-fold cross-validation procedure carried out in our experiments.

