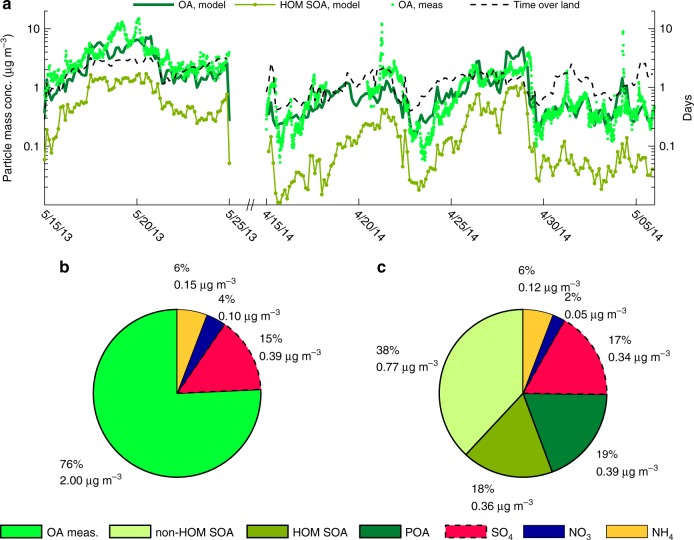
Fig. 6.
Aerosol particle chemical composition. Measured and modelled particle chemical composition at the Station for Measuring Ecosystem-Atmosphere Relations II (SMEAR II) station for the periods 15–24 May 2013 and 15 April to 5 May 2014. Panel a shows the measured and modelled submicron organic aerosol (OA) mass concentrations. Shown are also the modelled Highly Oxygenated organic Molecule Secondary Organic Aerosol (HOM SOA) mass and the number of days the air masses have spent over land upwind SMEAR II. Panels b and c show the average measured and modelled non-refractory submicron particle chemical composition, respectively. SOA accounts for 56% and the primary organic aerosol (POA) for 19% of the modelled submicron particle mass concentration respectively. The POA mainly originates from small-scale wood combustion and road traffic

