Figure 2.
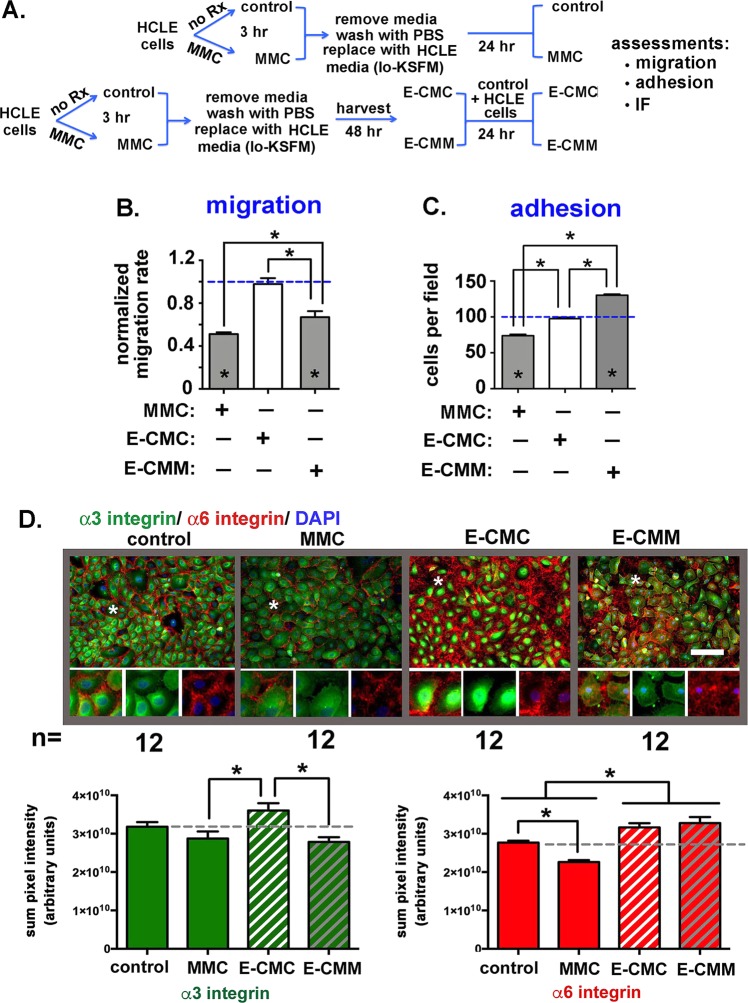
Transient treatment of HCLE cells with MMC for 3 hours induces secretion of molecules into their media that reduce HCLE adhesion, increase migration, and alters expression of α3 and α6 integrins. (A) The schematic diagram shows how conditioned media was prepared from control (E-CMC) and MMC treated (E-CMM) HCLE cells and used to assess cell migration and adhesion in HCLE that were not exposed to MMC. (B) Random cell migration rates were determined by time lapse microscopy performed as described in Fig. 1. Data are expressed normalized against the migration of untreated control cells incubated in standard HCLE media. Direct MMC-treated cells were included in the analysis. E-CMC did not alter HCLE cell migration rates compared to controls whereas E-CMM significantly reduced the migration rate of HCLE cells. C. Cells grown in E-CMC and E-CMM overnight were used in adhesion assays along with controls and cells treated with MMC for 3 hours that were allowed to recover overnight. As expected, direct treatment with MMC reduced adhesion. Cells grown overnight in E-CMC adhered similarly to control cells whereas cells treated with E-CMM have increased adhesion. In (B,C) asterisks within bars indicate significant differences compared to untreated control cells whereas asterisks above bars indicate significant difference between treatment groups. (D) Indirect immunofluorescence was performed to assess the localization and expression of α3 and α6 integrins in HCLE cells treated with MMC for 3 hours, as well as in HCLE cells incubated in E-CMC and E-CMM. The regions highlighted by asterisks in each panel were magnified 3-fold and presented in the insets to make it easier to appreciate differences in the localization of α3 and α6 integrins. Expression was quantified for each integrin in 12 separate fields in 3 separate wells for control and MMC and 8 separate fields in 3 separate wells for E-CMC and E-CMM and data are expressed as the summation of pixel intensities per field. There is less α3 integrin expressed in HCLE cells after MMC treatment, but the difference is not significant compared to controls. Growing cells in E-CMC increases α3 integrin expression relative to MMC treated cells whereas E-CMM reduces α3 integrin. There is significantly less α6 integrin expressed after MMC treatment. Growing cells in E-CMC and E-CMM increased α6 integrin expression relative to both controls and MMC treated cells. The magnification bar equals 40 μm.

