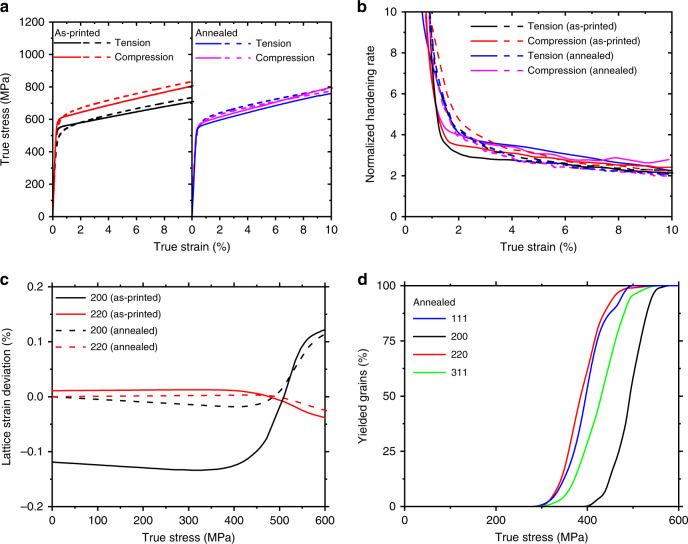
Fig. 6.
CPFE results of tension–compression asymmetry of AM stainless steel. a Comparison of true stress–strain curves under uniaxial tension and compression from experiment (solid lines) and simulation (dashed lines) for as-printed and annealed samples. b Comparison of normalized strain hardening rate vs. true strain under uniaxial tension and compression from the experiment (solid lines) and simulation (dashed lines) for as-printed and annealed samples. c Simulated lattice strain deviation (Δεhkl) as a function of applied stress for {200} and {220} grain families for as-printed and annealed samples under uniaxial tension. d Simulated volume fraction of plastically yielded grains within each family against the macroscopic true stress in the annealed sample, showing progressive plastic yielding among different grain families

