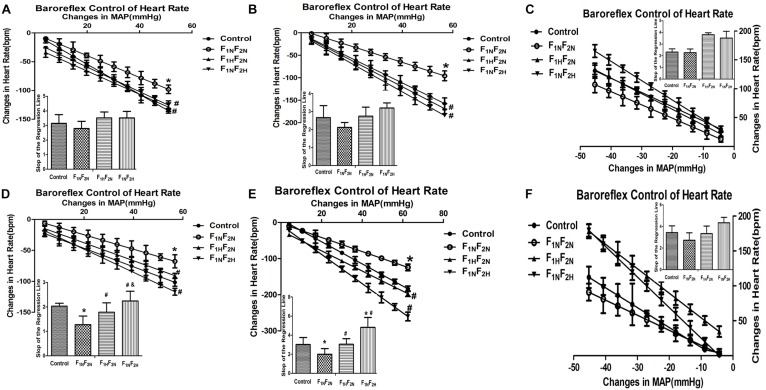
FIGURE 3.
Baroreflex control of HR in conscious male offspring from Control, F1NF2N (the offspring of RVH rats), F1HF2N (RVH rats treated with NaHS, offspring without NaHS), F1NF2H (maternal RVH rats treated without NaHS and the offspring with NaHS after weaning) (n = 6). The graph shows regression lines relating reflex bradycardia responses to Ang II and PHE or reflex tachycardia responses to SNP. Baroreflex sensitivity index expressed by the slop of the regression line. Panels (A–C) represent Ang II, PHE, SNP respectively at 8 weeks. Panels (D–F) represent Ang II, PHE, SNP respectively at 16 weeks. ∗P < 0.05 compared with Control group. #P < 0.05 compared with F1NF2N group. &P < 0.05 compared with F1HF2N group. Values are means ± SD.

