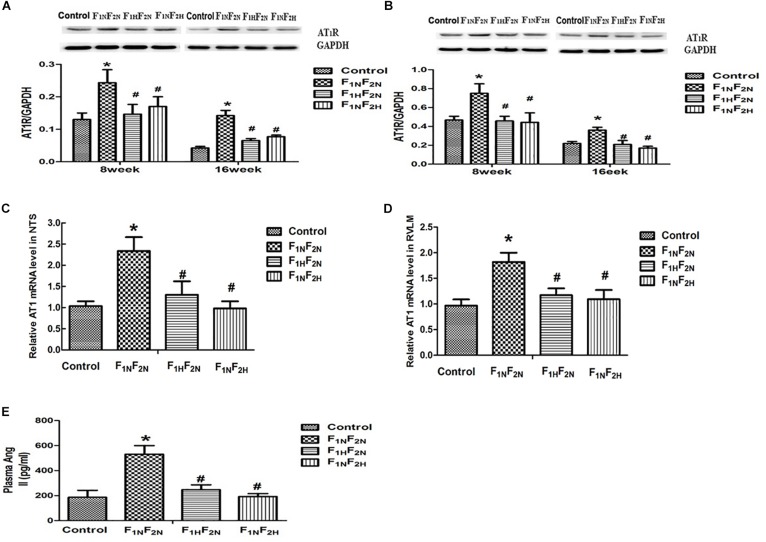
FIGURE 5.
The plasma level of Ang II, and the protein and mRNA expression of AT1 in male offspring. Expression of AT1R in NTS and RVLM of offspring from Control, F1NF2N (the offspring of RVH rats), F1HF2N (RVH rats treated with NaHS, offspring without NaHS), F1NF2H (maternal RVH rats treated without NaHS and the offspring with NaHS after weaning). Panels (A,B) representative the protein level of AT1 of male offspring at 8 weeks and 16 weeks in NTS and RVLM respectively. Panels (C,D) representative mRNA level of AT1 at 16 weeks. GAPDH was used to normalize. Panel (E) represented plasma Ang II in male offspring at 16 weeks. ∗P < 0.05 vs. Control group, #P < 0.05 vs. F1NF2N group. Values are means ± SD (n = 6–12).

