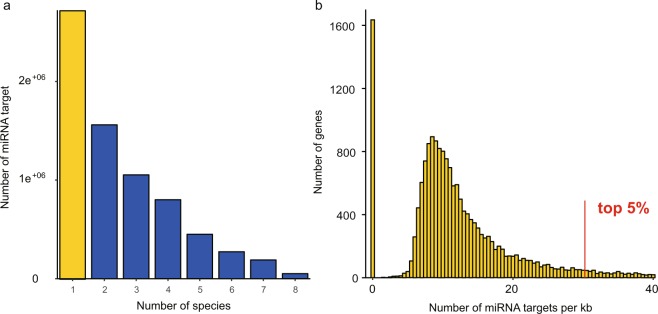
Figure 5.
Evolutionary patterns of miRNA target sites. (a) The number of predicted miRNA target sites. Species-specific target sites are shown in yellow bar and other target sites with different level of conservation are shown in blue bars. (b) Distribution of species-specific miRNA targets in genes. For each gene, the density of species-specific targets was counted based on the length of the 3′ UTR. Some genes at the right tail exhibit extremely high emergence rates of species-specific targets. The top 5% genes were selected for GO enrichment test.

