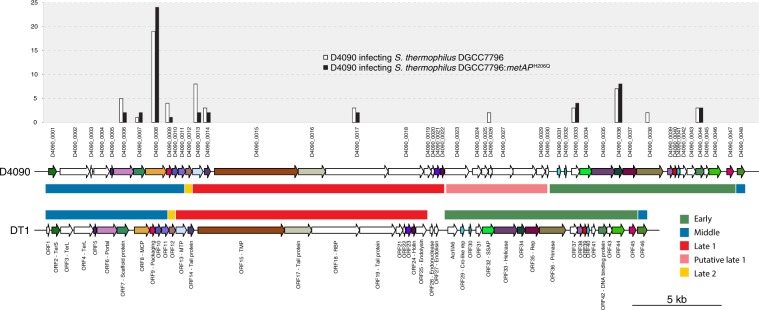
Figure 3.
Genetic alignment of phages D4090 and DT1. Each protein-coding gene is represented by an arrow. When two deduced proteins share 70% identity or more, they are represented with the same color, otherwise they are shown in white. The boxes between the two genomes represent the expression modules. Phage D4090 expression modules were extrapolated from DT1 experimental data. The graph above the alignment represents the relative abundance of the proteins when phage D4090 infects the wild-type strain DGCC7796 and mutant DGCC7796:metAPH206Q.

