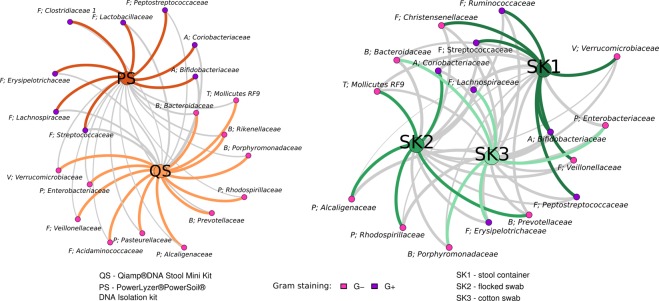
Figure 5.
Association of bacterial families significantly differentially abundant between different sampling and isolation kits. The strength of the edges is weighted by relative abundance of taxa between the different kits (the stronger the edge, the larger the difference). Color-coding of the edges highlights taxa belonging to the same community, as detected by network modularity (see Methods for details). Grey edges represent connections between different communities.

