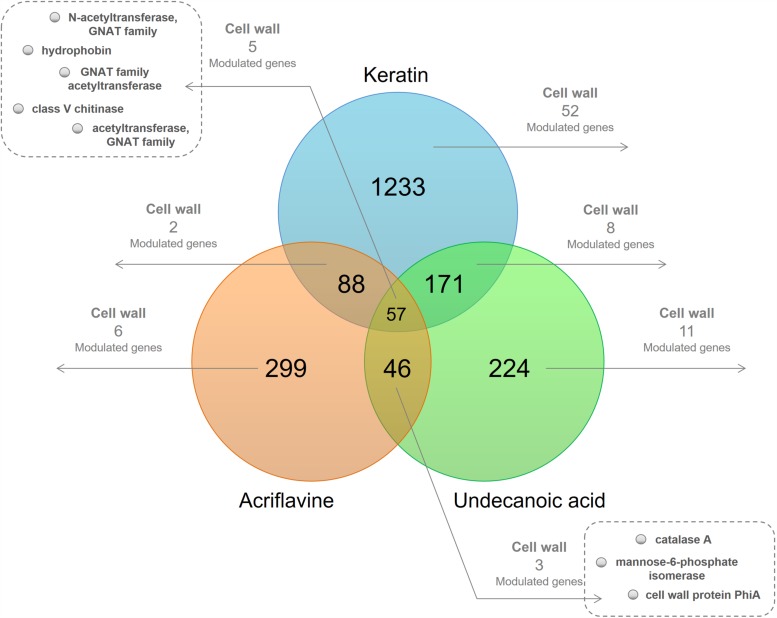
FIGURE 1.
Venn diagram of the differentially expressed genes (DEGs) in the libraries. At the intersections, number of genes modulated in at least one of the time points of each of the three libraries. The number of modulated cell wall-related genes present in at least one of the time points are highlighted.

