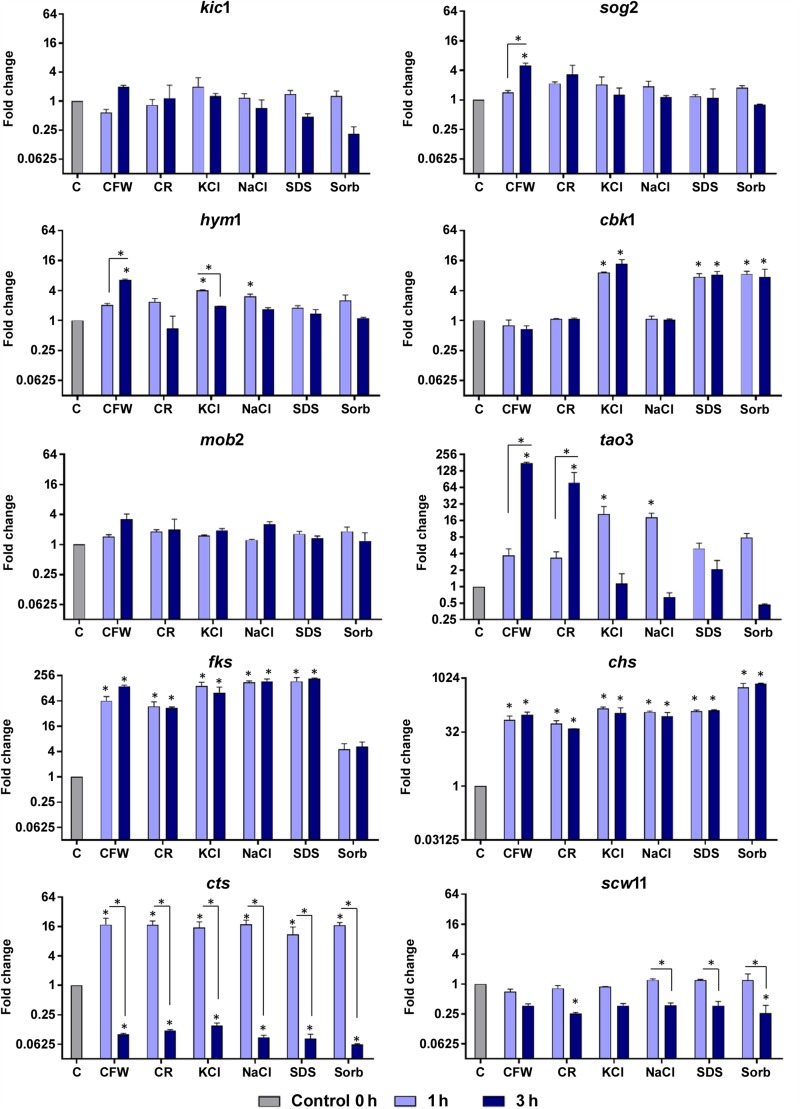
FIGURE 4.
Relative expression levels of genes encoding components of the RAM network or putatively regulated by Ace2 after exposure of T. rubrum to Calcofluor White (CFW), Congo Red (CR), KCl, NaCl, SDS, and sorbitol (Sorb), for 1 or 3 h. Control (C) is the growth of T. rubrum for 96 h before addition of the stressors. Data are means and SD of three independent experiments. Asterisks indicate statistical significance determined by ANOVA followed by Tukey’s ad hoc test (P < 0.05).

