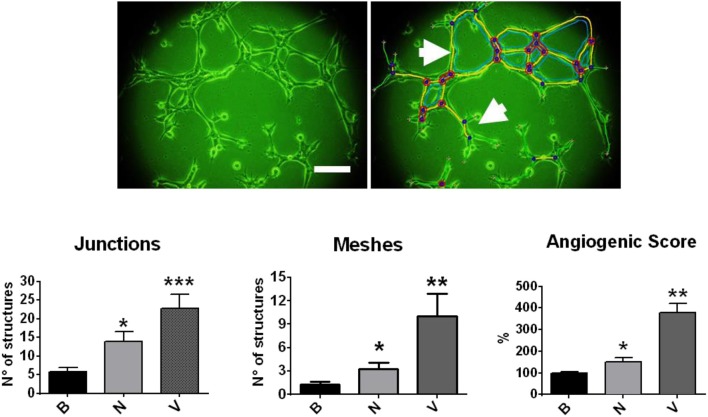
Figure 2.
Effect of NGF and VEGF in a tubular formation assay in matrigel with EA.hy926 cells. Cells were disposed in matrigel and stimulated with NGF (N) and VEGF (V). Upper picture: photography of EA.hy926 cells (4 h of assay), which was analyzed by Image J Angiogenesis Analyzer. Bar charts were obtained from multicellular junctions and polygonal structures or meshes, as the arrows indicate. *p < 0.05; **p < 0.01; ***p < 0.001, according to Kruskal Wallis test. Figure obtained from Supplementary Material of Garrido et al. (87) (permission has been obtained).

