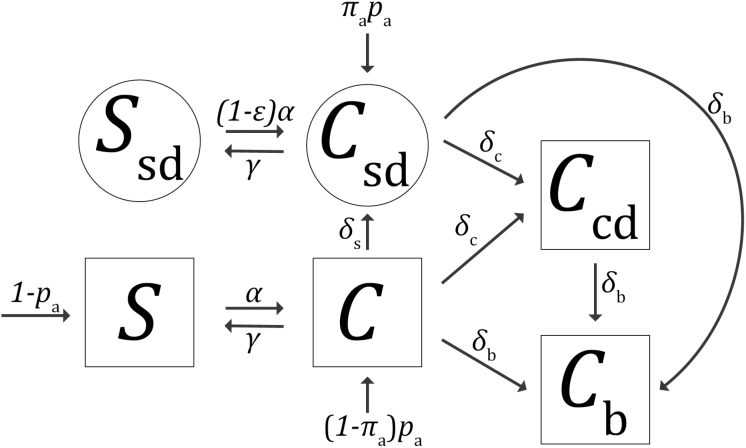
Figure 1.
Patient states and state transitions. Squares depict possible states in the preintervention model; circled states are added in the postintervention model. Arrows between shapes depict possible state transitions during the long-term acute care hospital stay and are labeled with rate parameters; arrows into shapes from outside depict possible states at admission and are labeled with probabilities of each admission state. Patients in any state can be removed via death or live discharge (not depicted; see Supplementary Materials).

