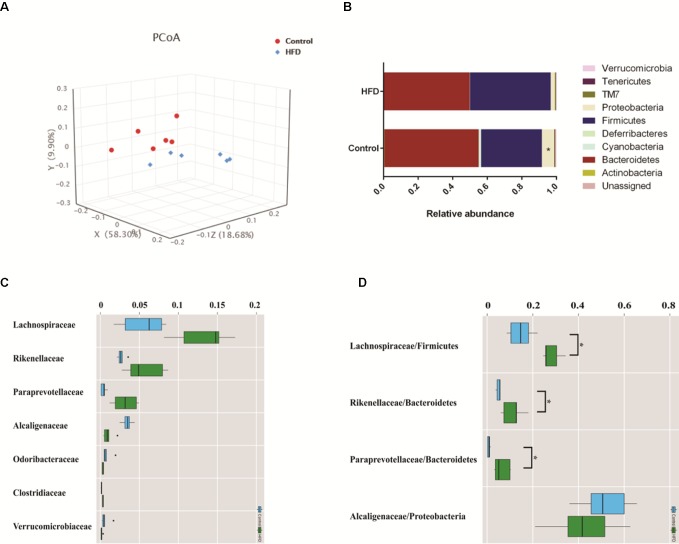
Figure 4.
HFD alters the composition of gut microbiome in C57BL/6J mice. Fecal samples were collected at week 4. Fecal DNA was subjected to 16S rRNA sequencing and analyzed with QIIME2. (version 2018.11). (A) Principal coordinates analysis (PCoA) plot of Bray–Curtis distance. Red spots represent samples from the control group, and blue spots represents samples from the HFD group. (B) The relative abundance of a major microbial phylum in the control and HFD group. Compared to the HFD group, proteobacteria was a higher abundance in the control group. Data are mean ± SD (*p < 0.05; Wilcoxon matched-pairs signed rank test and Mann–Whitney U test). (C) Relative abundance of a major microbial family in the control and HFD group. The seven abundant families are shown. Data are mean ± SD (*p < 0.05; Wilcoxon matched-pairs signed rank test and Mann–Whitney U test). (D) The ratio of the major microbial family/phylum in the control and HFD group. Data are mean ± SD (*p < 0.05; Wilcoxon matched-pairs signed rank test and Mann–Whitney U test).

