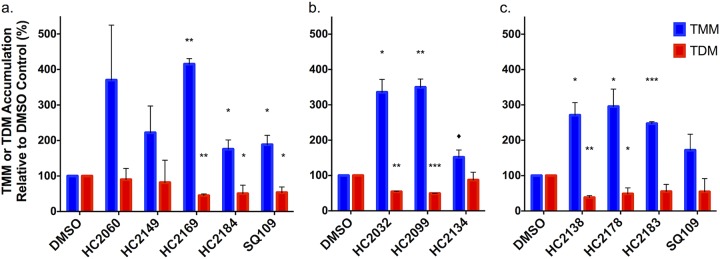
FIG 2.
Modulation of TMM and TDM accumulation. (a) Whole-cell 14C-lipids from M. tuberculosis cells treated with 20 μM HC2060, HC2149, HC2169, and HC2184 show increased levels of TMM and decreased levels of TDM. (b and c) Whole-cell 14C-lipids from M. tuberculosis cells treated with a concentration of 20 μM of the six inhibitors identified by the targeted phenotypic screen show increased levels of TMM and decreased levels of TDM. Experiments were conducted in biological duplicates. In both experiments, M. tuberculosis samples were treated with DMSO or 20 μM SQ109 as controls. Error bars indicate the standard deviations. *, P < 0.05; **, <0.005; ***, <0.001; ♦, value that just missed the cut off (P = 0.07 compared to TMM level after HC2134 treatment). The results for HC2060 and HC2149 missed the significance cutoff, but this may be due to the high variability in replicates, as there was a >2-fold difference for HC2060 and HC2149.

