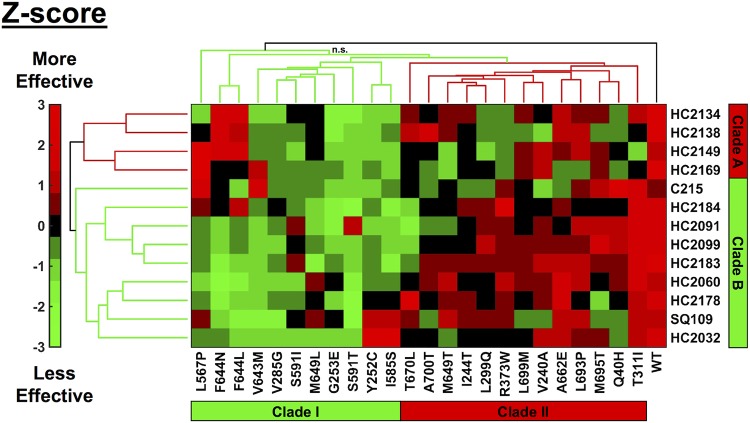
FIG 5.
Cross-resistance profiling identifies clustering of compounds and mutations. Cluster analysis of cross-resistance profiling of 24 mmpL3 strains treated with each of the 13 MmpL3 inhibitors normalized by Z-scoring by treatment. Compounds clustered into two clades: clade A and clade B. Mutant strains, denoted by amino acid substitution, clustered into two clades: clade I and clade II. Colors are based on Z-score normalization of treatment; green indicates when treatments were less effective than the average, and red indicates when treatments were more effective than the average. Black (n.s., not significant) indicates a branch where the approximate unbiased (AU) value was <75. All other branches were significant based on bootstrap AU values of >75.

