In this study, we analyzed the global metabolomic changes associated with Toxoplasma gondii infection in mice in the presence or absence of sulfadiazine sodium (SDZ) treatment. BALB/c mice were infected with T. gondii GT1 strain and treated orally with SDZ (250 μg/ml in water) for 12 consecutive days. Mice showed typical manifestations of illness at 20 days postinfection (dpi); by 30 dpi, 20% had survived and developed latent infection.
KEYWORDS: Toxoplasma gondii, biomarkers, metabolomics, mice, serum metabolites, sulfadiazine sodium
ABSTRACT
In this study, we analyzed the global metabolomic changes associated with Toxoplasma gondii infection in mice in the presence or absence of sulfadiazine sodium (SDZ) treatment. BALB/c mice were infected with T. gondii GT1 strain and treated orally with SDZ (250 μg/ml in water) for 12 consecutive days. Mice showed typical manifestations of illness at 20 days postinfection (dpi); by 30 dpi, 20% had survived and developed latent infection. We used ultraperformance liquid chromatography-mass spectrometry to profile the serum metabolomes in control (untreated and uninfected) mice, acutely infected mice, and SDZ-treated and infected mice. Infection induced significant perturbations in the metabolism of α-linolenic acid, purine, pyrimidine, arginine, tryptophan, valine, glycerophospholipids, and fatty acyls. However, treatment with SDZ seemed to alleviate the serum metabolic alterations caused by infection. The restoration of the serum metabolite levels in the treated mice was associated with better clinical outcomes. These data indicate that untargeted metabolomics can reveal biochemical pathways associated with restoration of the metabolic status of T. gondii-infected mice following SDZ treatment and could be used to monitor responses to SDZ treatment. This study provides a new systems approach to elucidate the metabolic and therapeutic effects of SDZ in the context of murine toxoplasmosis.
INTRODUCTION
Toxoplasma gondii, an obligate intracellular protozoan parasite, is highly prevalent in warm-blooded animals and humans (1). T. gondii comprises three clonal lineages (type I, type II, and type III) (2). Despite 98% genetic similarity, dramatic differences in virulence exist among strains belonging to these T. gondii genotypes (3). Humans acquire infection mainly by ingesting undercooked meat containing tissue cysts or oocysts from contaminated water (4). Acute infection with this parasite is mediated by the aggressive, fast-replicating, tachyzoite stage, which can cause encephalitis or retinochoroiditis. In addition, reactivation of the latent form (i.e., bradyzoites-containing cysts) of T. gondii can cause life-threatening conditions and even death in immunocompromised individuals (5). However, infection of immunocompetent individuals is generally asymptomatic and often involves type II or type III strains (6).
Sulfadiazine sodium (SDZ) has been widely used to treat noncongenital cases of toxoplasmosis and often is used in combination with pyrimethamine (7). The mechanism of SDZ action involves inhibiting the enzyme dihydropteroate synthase, which is indispensable for folate biosynthesis (8). The clinical use of SDZ is often associated with side effects, such as nausea, diarrhea, headache, fever, rash, depression, and pancreatitis (9–11). The pathways underlying therapeutic and/or toxic properties of SDZ remain unknown but are likely related to alterations in the host metabolism. Therefore, understanding the underlying metabolomic changes associated with SDZ treatment is important.
Global, high-throughput, metabolite profiling provides the opportunity to identify the metabolic pathways underlying the severity of disease, therapeutic responses to treatment, and derangement and restoration of metabolic homeostasis (12–15). The identification of perturbed biochemical pathways may lead to the recognition of specific metabolomic patterns associated with drug efficacy and adverse reactions (16, 17). Liquid chromatography-mass spectrometry (LC-MS)-based metabolomic analysis has been a powerful approach used for metabolic profiling of biological systems in health and disease (18). Compared with NMR spectroscopy, LC-MS analysis possesses higher sensitivity and a broader polarity range (19–21).
In the present study, we used high performance LC-tandem mass spectrometry (MS/MS) to test whether therapeutic interventions using SDZ, aimed at controlling T. gondii infection, could also attenuate the metabolic changes associated with T. gondii infection in mice. Our analysis revealed dysregulation of several metabolites involved in lipid and amino acid metabolism, with partial restoration following SDZ treatment of T. gondii-infected mice.
RESULTS
Therapeutic efficacy of SDZ in mice.
Here, we determined the most effective dosage and duration of treatment using SDZ. As shown in Fig. 1A, infected mice that received a 12-day treatment regimen had a 20% survival rate. All infected mice in the untreated group died at 7 days postinfection (dpi), whereas control mice did not exhibit any clinical signs during the entire course of infection. Next, we studied whether the therapeutic effect of SDZ was dose dependent. We treated mice orally with 150, 200, 250, or 300 μg/ml SDZ 2 days after infection with T. gondii GT1 strain. As shown in Fig. 1B, oral administration of 250 μg/ml SDZ protected 20% of infected mice for more than 1 month. A number of multifocally distributed tissue cysts were detected at 30 dpi (see Fig. S1 in the supplemental material).
FIG 1.
Survival rates for control, untreated, and SDZ-treated mice plotted over time following T. gondii infection. (A) Survival of T. gondii-infected mice increased as the treatment duration increased. (B) A dose of 250 μg/ml was the optimal treatment dosage.
Metabolites distinguishing between treated and control mouse groups.
We compared the serum metabolic profiles between infected, untreated, or SDZ-treated mice and healthy (control) mice. The collected serum samples were processed for untargeted LC-MS/MS-based metabolomic analysis as summarized in Fig. 2. As shown in Fig. S2, all total ion chromatograms of quality control (QC) samples showed no distinct peak drifts, with stable retention times. In electrospray ionization positive-ion (ESI+) mode and electrospray ionization negative-ion (ESI−) mode, 9,894 and 6,532 ions, respectively, were determined in each sample profile. After elimination of low-quality ions with relative standard deviation (RSD) values of >30%, 8,821 and 5,218 ions were identified in ESI+ mode and ESI− mode, respectively. QC data were further interrogated using principal-component analysis (PCA). As shown in Fig. S3, all QC samples clustered closely together and there was an obvious separation between the tested samples and the QC samples, which demonstrated the high stability and reproducibility of the LC-MS/MS analytical platform used in the present study.
FIG 2.
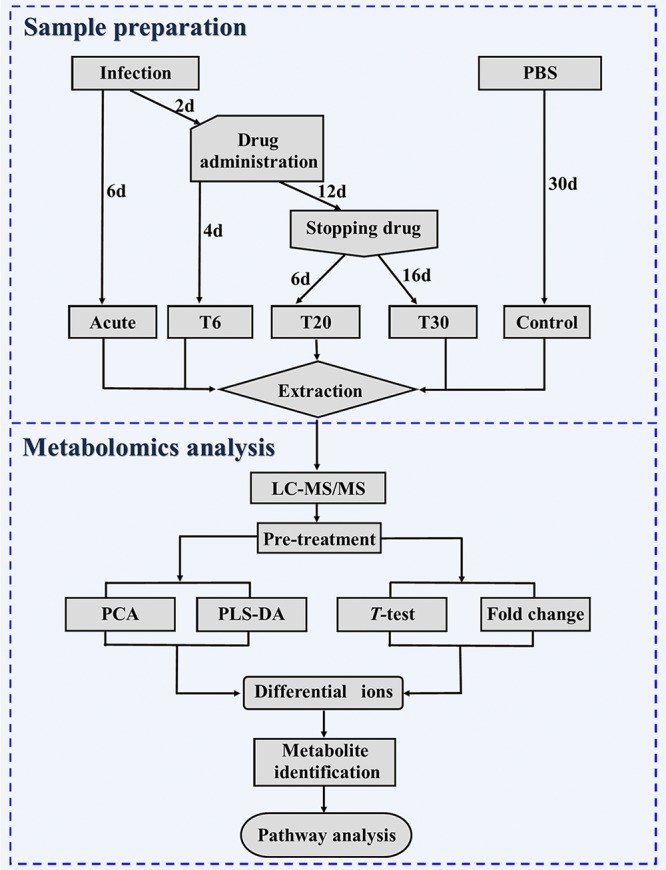
Schematic diagram of the experimental design. Serum samples from control untreated mice and treated mice (T6, T20, and T30 groups) were subjected to LC-MS/MS analysis.
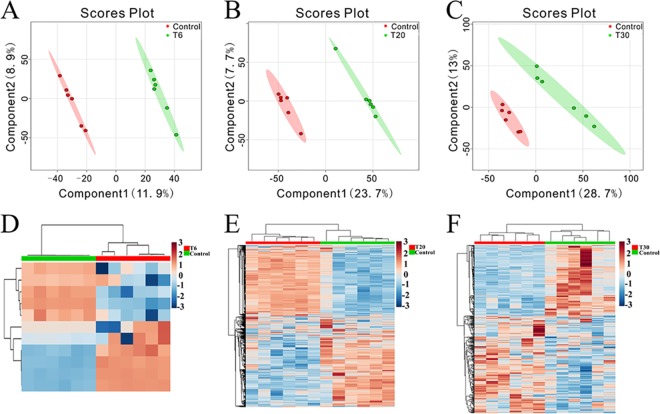
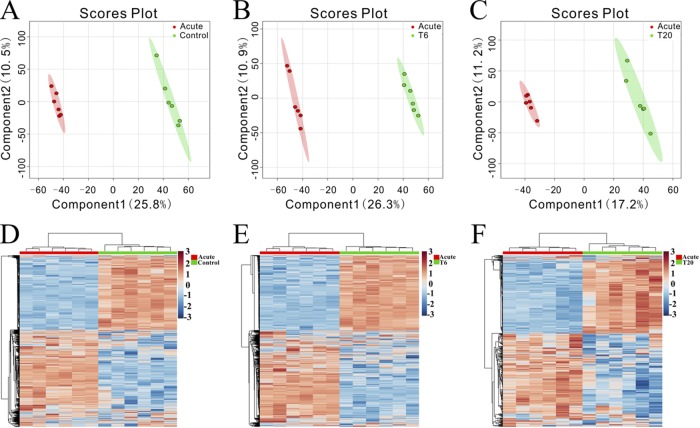
Changes in metabolite profiles in both ion modes over the duration of treatment were also detected using two-dimensional PCA score plots. As shown in Fig. S4, samples from different groups were intermixed and the score plots did not show good separation. Subsequently, score scatter plots for two-dimensional partial least-squares-discriminate analysis (PLS-DA) models showed satisfactory modeling and discriminated the treatment groups from the control group in both ESI+ mode (Fig. 3A to C) and ESI− mode (Fig. S5A to C). Serum metabolites passing the variable importance in the projection (VIP) threshold (VIP of >1) and the Student t test (P < 0.05) were selected as significantly different between the two groups. Heatmaps constructed based on significantly differentially abundant metabolites also showed clear separation between treatment groups and the control group in ESI+ mode (Fig. 3D to F) and ESI− mode (Fig. S5D to F). Similarly, two-component PLS-DA models were constructed to discriminate the acutely infected mouse group from the other groups, achieving distinct separation between the corresponding groups in both ESI+ mode (Fig. 4A to C) and ESI− mode (Fig. S6A to C). Interestingly, heatmaps constructed based on differentially abundant metabolites for acutely infected mice versus other groups showed clear clustering (Fig. 4D to F; also see Fig. S6D to F), demonstrating that the mouse serum metabolic phenotypes could be discriminated by the two-component PLS-DA models.
FIG 3.
Discrimination between treated and control mice based on ESI+-mode-derived metabolic phenotypes of serum. (A to C) PLS-DA score plots for the T6 group versus the control group (A), the T20 group versus the control group (B), and the T30 group versus the control group (C). (D to F) Heatmaps of the differential metabolites for the T6 group versus the control group (D), the T20 group versus the control group (E), and the T30 group versus the control group (F).
FIG 4.
Discrimination between the control group, the T6 group, and the T20 group versus acutely infected (acute) mice based on ESI+-mode-derived serum metabolic profiles. (A to C) PLS-DA score plots for control versus acutely infected mice (A), the T6 group versus acutely infected mice (B), and the T20 group versus acutely infected mice (C). (D to F) Heatmaps of the top differential metabolites for control versus acutely infected mice (D), the T6 group versus acutely infected mice (E), and the T20 group versus acutely infected mice (F).
Temporal changes in metabolic profiles.
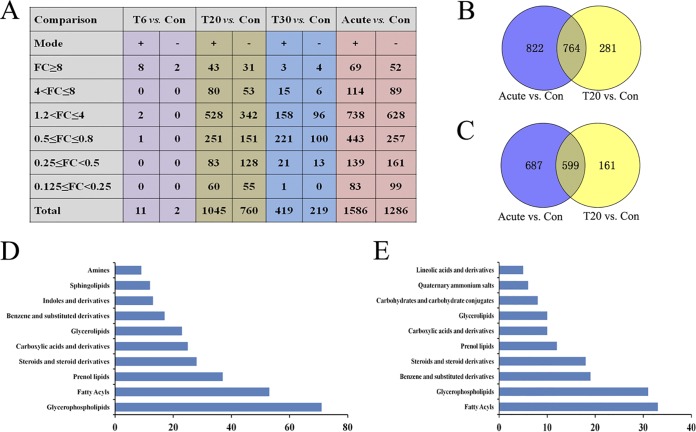
Here, we identified differences in metabolites between treated and control mouse groups over the course of infection (acute, T6, T20, and T30 groups). A total of 3,142 differential metabolite ions (DMIs) were detected for the acutely infected versus control mouse groups. Among these DMIs, 870, 133, and 74 metabolite ions produced >1.2-, 4-, and 8-fold changes, respectively. In contrast, the expression levels of 402, 211, and 115 metabolite ions were decreased by >0.8-, 2-, and 4-fold, respectively (Fig. 5A). Only 13 DMIs were detected in the T6 treatment group, indicating that SDZ temporarily maintained the metabolic homeostasis in the treated mice. The serum metabolic profiles in the T20 group changed significantly, compared to the control, and 1,805 DMIs were detected in both ion modes. The number of differentially abundant metabolites decreased over time as the infected mice partly restored the dysregulated metabolic state (T30 group versus control group).
FIG 5.
Global view of the temporal metabolic expression profiles during SDZ treatment. (A) Statistics for differentially expressed metabolites among samples. FC, fold change; Con, control. (B and C) Venn diagram analysis of differentially abundant metabolites between SDZ-treated (T20) and untreated acutely infected mice versus control (PBS-treated) mice. The numbers in the overlapping part of the circles represent common differentially abundant metabolites between the mouse groups in the ESI+ mode (B) and ESI– mode (C). (D) Top 10 enriched metabolite classes common for the acute group versus the control group and the T20 group versus the control group in ESI+ mode. (E) Top 10 enriched metabolite classes common for the acute group versus the control group and the T20 group versus the control group in ESI− mode. The x axis represents the number of metabolites for the chemical classes mentioned on the y axis.
There were dramatic metabolic changes for the acute group versus the control group and the T20 group versus the control group. Of the 1,867 DMIs detected in ESI+ mode, 764 were common for the acute group versus the control group and the T20 group versus the control group (Fig. 5B). By searching against mass-based metabolomic databases, the metabolite ions detected in both ESI+ and ESI− modes were determined to include glycerophospholipids, sphingolipids, quinolines, glycerolipids, pyrimidines, sterols, fatty acyls, acyl-carnitines, prenols, amino acids, and other organic compounds. As shown in Fig. 5D, “glycerophospholipids,” “fatty acyls,” and “prenol lipids” had the largest numbers of common metabolites identified in the acute group versus the control group and the T20 group versus the control group. In the ESI− mode, 599 DMIs were common in the acute group versus the control group and the T20 group versus the control group (Fig. 5C); “fatty acyls,” “glycerophospholipids,” and “benzene and substituted derivatives” were the three most enriched categories (Fig. 5E).
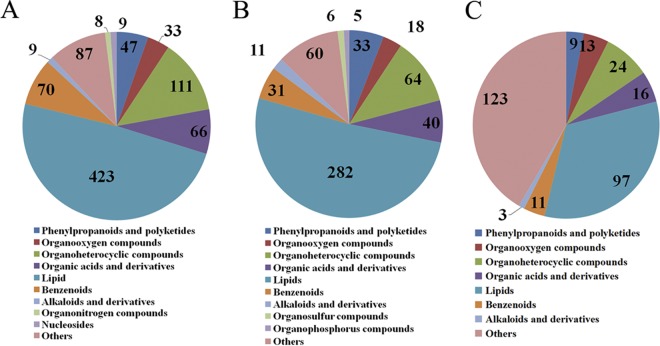
As shown in Fig. 6, we categorized all of the annotated differentially abundant metabolites detected in each comparison pair. In the ESI+ mode, the lipid category was the largest category in all three-comparison pairs, followed by organoheterocyclic compounds. Interestingly, the lipid category was also the overrepresented metabolic category in ESI− mode (Fig. S7). These results indicate that lipid metabolism is significantly disturbed during T. gondii infection and SDZ treatment. All lipids were categorized based on the LIPID MAPS comprehensive classification system. In ESI+ mode, “glycerophospholipid” was the overrepresented metabolite class among the three comparison pairs (Fig. S8A to C). In ESI− mode, however, “glycerophospholipid” was the most overrepresented class in both the acute group versus the control group and the T20 group versus the control group; for the T30 group versus the control group, “steroid and steroid derivatives” was the most represented class (Fig. S8D to F). Three amino acids, namely, arginine, tryptophan, and valine, showed periodic fluctuations (Fig. 7).
FIG 6.
Summary statistics for the annotated differential metabolites identified among different groups in ESI+ mode. (A) Ten largest categories for mice in the acute infection group versus the control group. (B) Ten largest categories for the T6 group versus the control group. (C) Eight largest categories for the T30 group versus the control group. The numbers in the Venn diagrams represent the numbers of the annotated differential metabolites.
FIG 7.
Amino acid fluctuations during SDZ treatment. The x axis represents the mouse experimental groups and the y axis represents the relative abundance of the corresponding amino acids. *, P < 0.05; **, P < 0.01; ***, P < 0.001.
Dysregulated metabolic pathways.
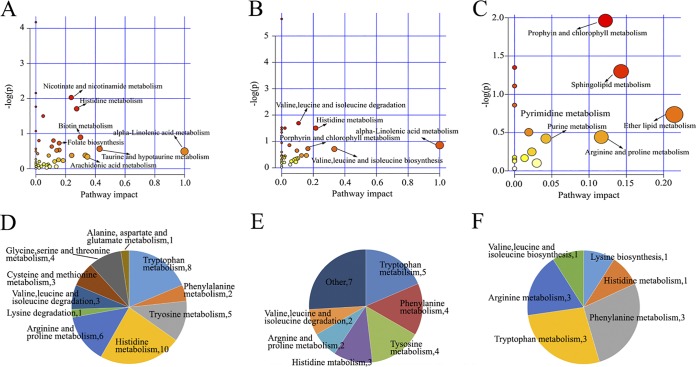
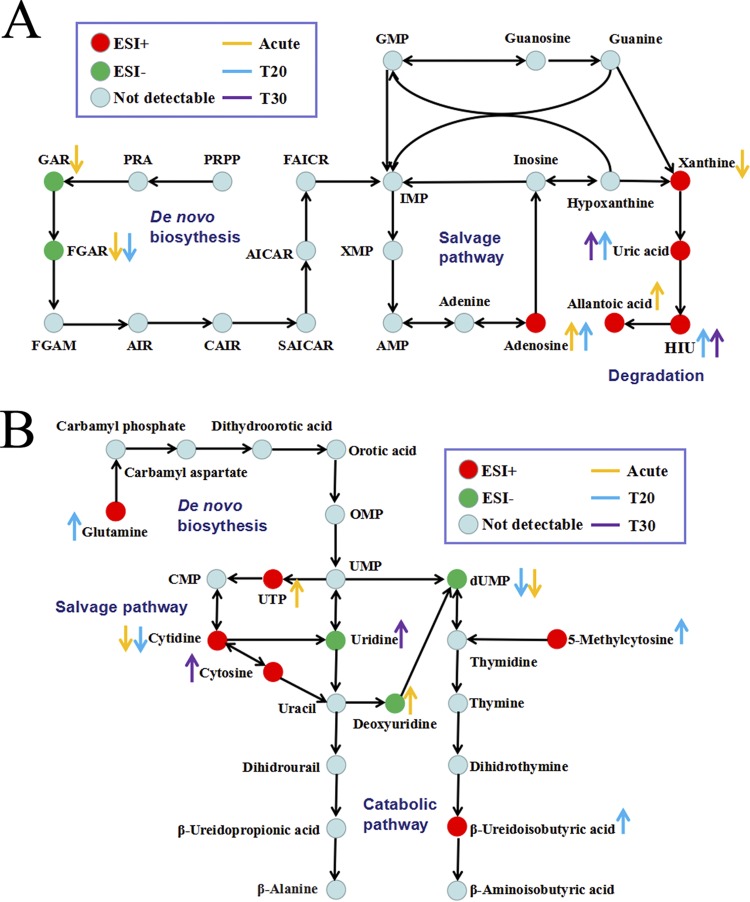
As shown in Fig. 8A, more than 20 metabolic pathways were affected in acutely infected mice (acute group). Of these, several pathways, such as histidine metabolism, vitamin B6 metabolism, glutamine metabolism, and taurine and hypotaurine metabolism, showed lower P values and greater pathway impact. Differential metabolites involved in amino acid metabolism were also analyzed. As shown in Fig. 8D, histidine metabolism, tryptophan metabolism, and arginine and proline metabolism were the three most affected pathways. Mice in the T20 group also showed dramatic metabolic variations, and metabolic pathways such as linoleic acid metabolism, glutamine metabolism, α-linoleic acid metabolism, and histidine metabolism were significantly perturbed (Fig. 8B). As shown in Fig. 8E, tryptophan metabolism, phenylalanine metabolism, and tyrosine metabolism were the three most affected amino acid metabolic pathways in the T20 group. Surviving mice in the T30 group showed improved metabolic balance, which correlated with improvement in the clinical manifestations. Pathways including porphyrin and chlorophyll metabolism, sphingolipid metabolism, and ether lipid metabolism were the most affected (Fig. 8C). Seven differential metabolites involved in purine metabolism were found, including N-formylglycinamide ribonucleotide, glycinamide ribonucleotide, xanthine, uric acid, allantoic acid, adenosine, and 5-hydroxyisourate (HIU) (Fig. 9A). Among these metabolites, uric acid, allantoic acid, and HIU were upregulated in the acute group versus the control group and the T20 group versus the control group, suggesting active purine degradation. Also, pyrimidine metabolism was affected during toxoplasmosis and treatment. Kyoto Encyclopedia of Genes and Genomes (KEGG) analysis showed that cytosine and uridine were upregulated in the T30 group versus the control group and cytidine and dUMP were both downregulated in the acute group versus the control group and the T20 group versus the control group (Fig. 9B).
FIG 8.
Perturbed metabolic pathways in T. gondii infection and SDZ treatment. (A to C) Pathway impacts resulting from the differential metabolites determined using MetaboAnalyst 3.0. Small P values and high pathway impact factors indicate that the pathway is greatly influenced. (A) Acute group versus the control group. (B) T20 group versus the control group. (C) T30 group versus the control group. (D to F) Distribution of differential metabolites involved in amino acid metabolism. (D) Acute group versus the control group. (E) T20 group versus the control group. (F) T30 group versus the control group. The numbers in the Venn diagrams represent the numbers of the differential metabolites involved in amino acid metabolism.
FIG 9.
Differential metabolites involved in purine metabolism (A) or pyrimidine metabolism (B). AICAR, aminoimidazolecarboxamide ribotide; AIR, 5-aminoimidazole ribonucleotide; CAIR, 4-carboxy aminoimidazole ribonucleotide; FAICR, formylaminoimidazole carboxamide ribotide; FGAM, formylglycinamidine ribonucleotide; FGAR, N-formylglycinamide ribonucleotide; GAR, glycinamide ribonucleotide; HIU, 5-hydroxyisourate; OMP, orotidine monophosphate; PRA, phosphoribosylamine; PRPP, phosphoribosyl pyrophosphate; SAICAR, succinylaminoimidazole carboxamide ribotide.
DISCUSSION
This study represents the first LC-MS/MS-based analysis of serum metabolites in mice infected with T. gondii in the presence or absence of SDZ treatment. Our results showed that SDZ treatment could ameliorate the metabolic alterations caused by T. gondii infection and might have contributed to the parasite differentiation from tachyzoites to bradyzoite-containing cysts.
BALB/c mice infected with genotype II parasites develop acute signs of illness at 11 dpi and establish chronic infections by 21 dpi. In contrast, without pharmaceutical intervention, mice infected with genotype I parasites develop acute toxoplasmosis and die within 10 days. In our previous study, 880 metabolites were altered in mice infected with genotype II T. gondii. These altered metabolites were involved in a range of metabolic pathways, including nucleotides, amino acids, fatty acyls, and central carbon metabolism intermediates (22). In the present study, genotype I parasites altered the abundance of 2,872 metabolites in mouse serum; most of these metabolites belonged to the category of lipid or lipid derivatives. In the first week after SDZ treatment, infected mice did not show any signs and only 13 differential metabolite features were detected. A relapse of acute signs occurred after the cessation of SDZ therapy, although 20% of the mice survived. The association between the reduction in the number of metabolites and mouse survival suggests that the observed clinical improvement might be attributed to SDZ treatment and the subsequent correction of the metabolic disturbances.
With searching against the Human Metabolome Database (HMDB), glycerophospholipids and fatty acyls were the overrepresented lipid classes in both ion modes. Glycerophospholipids are key components of the lipid bilayers in biological membranes and are involved in various signaling processes (23). The fatty acyls are a diverse group of molecules synthesized through chain elongation of an acetyl-coenzyme A (CoA) primer with malonyl-CoA, and they contribute to various biological processes (24). We also categorized the differential metabolites among infected, treated, and control groups. By comparing all mouse group pairs, lipid was found to be the most perturbed category. “Glycerophospholipids,” “fatty acyls,” and “prenol lipid” were the three most perturbed classes in ESI+ mode. In ESI− mode, however, “steroid and steroid derivatives” was the second largest class in a comparison of the T30 group versus the control group, indicating that the serum metabolome in the T30 group differed from those in the acute and T20 groups in both the number and type of metabolites.
We also detected alterations in amino acids involved in arginine, tryptophan, and valine metabolism. T. gondii acquires arginine from the host, and arginine limitation significantly reduces parasite growth (25). The marked decline of arginine abundance in the acutely infected and T20 mouse groups might reflect the increased nutritional demand for arginine by the rapidly proliferating parasites. Interestingly, a previous study showed that arginine starvation could induce cyst-like structures (26), which is consistent with our finding of parasite cysts in the T30 mouse group. The essential biological functions of amino acids make them possible targets for host-mediated disease therapy. For example, arginine deiminase, an arginine-degrading enzyme, was shown to be effective in the treatment of arginine-auxotrophic tumors (27). Tryptophan (Trp) levels were also decreased in acutely infected mice, which is consistent with a previous study (28). Indoleamine 2,3-dioxygenase (IDO) is an important enzyme in the kynurenine pathway. T. gondii growth can be reduced by Trp degradation into kynurenine, through induction of IDO mediated by gamma interferon (29). Kynurenine is an aryl hydrocarbon receptor agonist and is important for the expansion of Treg cells (30), which play an important role in maintaining immune homeostasis by actively suppressing the proinflammatory response. Compared with the acutely infected group, mice in the T20 group showed slightly higher levels of Trp, which might account for the improved survival rate.
To obtain more insight into the metabolic changes, we performed pathway analysis of the serum metabolome. α-Linolenic acid is an essential nutrient that functions as a substrate for the synthesis of long-chain fatty acids (31). The α-linolenic acid pathway was severely compromised in acutely infected mice, which was related to the reduced appetite of infected mice. This finding agrees with the previous observation that T. gondii infection of mice significantly influenced the linolenic acid pathway 11 days after infection with cysts of the genotype II PRU strain. In the T20 group, valine, leucine and isoleucine degradation and biosynthesis pathways were significantly perturbed. Valine, leucine, and isoleucine represent a potential source of energy and serve as building blocks for the synthesis of other amino acids (32). Trp metabolism is essential for normal growth in young animals and is necessary for the maintenance of nitrogen equilibrium in mature animals (33). The number of differential metabolites involved in Trp metabolism was considerable. These findings indicate that nitrogen metabolism of mice could be disturbed during acute infection and in the T20 group. Purine metabolism and pyrimidine metabolism were significantly affected in the T30 group. Cytidine and cytosine, two intermediates in pyrimidine metabolism, were upregulated in T30 group, pointing to increased DNA repair activities.
In conclusion, we performed the first untargeted LC-MS/MS-based metabolomic profiling of serum from mice infected with T. gondii in the presence or absence of SDZ treatment. Multivariate statistical analysis showed different serum metabolites for the infected and treated versus untreated groups, indicating that SDZ treatment influences the metabolism of T. gondii-infected mice. Changes in the metabolite levels in SDZ-treated mice over time revealed metabolites associated with clinical improvement, suggesting that the therapeutic efficacy of SDZ against T. gondii infections may have a metabolic basis. These results improved our understanding of the systemic metabolic response of T. gondii-infected mice treated with SDZ. Future studies incorporating metabolomic approaches will be of great value in guiding future preclinical investigations concerning pharmacotherapy of toxoplasmosis.
MATERIALS AND METHODS
Ethics statement.
The study was approved by the Animal Ethics Committee of Lanzhou Veterinary Research Institute, Chinese Academy of Agriculture Sciences (permit no. LVRIAEC2016-007). All experiments were performed strictly according to the requirements of the Animal Ethics Procedures and Guidelines of the People’s Republic of China.
Chemicals.
Sulfadiazine sodium salt (purity of ≥98%) was purchased from Sigma-Aldrich Co. (St. Louis, MO, USA). MS-grade water, acetonitrile, and methanol were purchased from Fischer Scientific (Morris Plains, NJ, USA). All other chemicals used were of the highest grade commercially available.
Mice and parasite.
Eight-week-old female BALB/c mice were purchased from the experimental animal center of Lanzhou Veterinary Research Institute, Chinese Academy of Agriculture Sciences, People’s Republic of China. All mice were fed and maintained under specific-pathogen-free conditions. All mice had free access to food and water and were kept in a temperature-controlled room (22 ± 0.5°C) with a seminatural light/dark cycle of 12 h/12 h. Mice were acclimated for 2 weeks before being used in the experiment. The T. gondii type I GT1 strain was used in this study. The tachyzoite stage of this parasite strain was maintained by serial passage in confluent monolayers of human foreskin fibroblasts (HFFs) (ATCC CRL-2522), which were cultured in Dulbecco’s modified Eagle’s medium (Gibco) supplemented with 10% heat-inactivated fetal bovine serum (Gibco), 2 mM l-glutamine, 100 U/ml penicillin, and 10 μg/ml streptomycin (34). All parasites and HFFs were maintained at 37°C in a 5% CO2 incubator.
Drug efficacy studies with SDZ.
Here, two experiments were performed in order to determine the most effective treatment regimen for SDZ. In the first experiment, we sought to determine the optimal duration of SDZ treatment that would enhance the animal survival rate. Forty mice were intraperitoneally (i.p.) infected with 103 T. gondii GT1 tachyzoites. After 2 days, infected mice were randomly allocated into four groups (10 mice/group). There was one vehicle-treated control group (sham treated with phosphate-buffered saline [PBS] only) and three treated groups (i.e., orally treated for 8, 10, or 12 days with 250 μg/ml SDZ diluted in filtered drinking water). The treatment dosage of 250 μg/ml per day was chosen based on a previous study (35). In the second experiment, we set out to examine whether the therapeutic effect of SDZ was dose dependent. Briefly, 50 BALB/c mice were randomly assigned to five groups (10 mice/group). All mice were i.p. infected as described above. After 2 days, one group received PBS only (vehicle control) and four groups were treated orally with 150, 200, 250, or 300 μg/ml SDZ. The deaths of mice were recorded daily, and the survival curve was produced using GraphPad Prism software.
Sample collection and metabolite extraction.
Serum was collected from the vehicle-treated control mouse group (control group) and the untreated plus infected group (acute group). Serum was collected from treated mouse groups at 6, 12, and 30 dpi (T6, T20, and T30 groups, respectively). The blood samples from all mouse groups were prepared as described previously (36). Briefly, blood was collected rapidly into Eppendorf tubes by retroorbital bleeding and was allowed to clot for 2 h, followed by centrifugation at 3,000 × g for 10 min at 4°C. Supernatants were collected, frozen in liquid N2 for 3 min, and transferred to a −80°C freezer until analysis. The metabolite extraction was performed as described previously (22). Briefly, serum samples were gradually defrosted by placing the tubes initially at −20°C for 30 min and then at 4°C. Aliquots (40 μl) of serum samples were mixed with 120 μl methanol (1:3 [vol/vol]) for 1 min. The mixture was kept at −20°C for 30 min, followed by centrifugation at 4,000 × g for 20 min at 4°C. About 20 μl of the supernatant was transferred into a new tube and mixed with 180 μl methanol before LC separation.
LC-MS-based metabolomics.
Metabolomic analysis was performed using a 2777C ultraperformance liquid chromatography (UPLC) system (Waters, Manchester, UK) coupled to a Synapt G2-XS quadrupole time of flight (TOF) MS system (Waters) equipped with an electrospray ionization (ESI) source. The separation of all samples was performed with a Waters Acquity UPLC BEH C18 column (100 by 2.1 mm; particle size, 1.8 μm). A gradient elution program was run for chromatographic separation with mobile phase A (water) and mobile phase B (acetonitrile), as follows: 0 to 2 min, 100% mobile phase A; 2 to 12 min, 100% mobile phase A to 0% mobile phase A; 12 to 14 min, 0% mobile phase A; 14 to 15 min, 0% mobile phase A to 100% mobile phase A. The injection volume was 10 μl, and the flow rate was set as 0.4 ml/min.
The mass spectrometer was operated in both positive-ion and negative-ion modes, with the following parameters: capillary, 1 kV (ESI+) or 2 kV (ESI−); sampling cone, 40 V; source temperature, 120°C; desolvation temperature, 500°C; desolvation gas, 800 liters/h (ESI+); cone gas, 50 liters/h; source offset, 80; TOF acquisition mode, sensitivity (ESI+) or sensitivity (ESI−); acquisition method, continuum MSE; TOF mass range, 100 to 1,200 Da; scan time, 0.1 s; collision energy function 2, trap CE ramp of 19 to 45 eV.
To evaluate the stability and reproducibility of the LC-MS analytical platform during data acquisition, QC samples were analyzed. The QC samples were prepared by mixing equal volumes (10 μl) from each serum sample as they were aliquoted for analysis. This pooled sample was used to provide a “mean” profile representing all analytes obtained during the analysis. The pooled QC sample was run 10 times at the beginning of the analysis and before and after each batch of 10 serum samples.
Data processing, mass spectral identification, and statistical analyses.
Raw metabolomic data sets were imported into the Progenesis QI 2.0 software package (Waters) for data processing, including untargeted peak detection, peak alignment, peak grouping, normalization, and integration. The normalized peak data were further processed using metaX software (37). Metabolites with RSD of >30% in QC pools were filtered out. Multivariate statistical analyses, including PCA and PLS-DA, were applied to identify outliers and to maximize the separation between groups, respectively (38). Differentially abundant metabolites that discriminated between test groups and the healthy controls were identified by VIP, with a threshold of >1, in the PLS-DA model. For each metabolite, the statistical significance of the difference between the means of two groups was determined using PCA. PLS-DA was used to distinguish two groups for each comparable group. We used the prcomp function in the R software package to perform PCA. The scores for Q2 (Q2Y, indicating the model performance) and R2 (R2Y, indicating how much of the variation within a data set can be explained by the various components of the model) were used to evaluate the quality and performance of the PLS-DA model. The data were converted to log2 values, and the Pareto scaling method was used for data scaling prior to analysis with the PLS-DA model (39, 40). The VIP threshold for the first two principal components of the multivariate PLS-DA model, as determined by metaX software, combined with the fold change and the P value from single-variable analysis, was used to identify the differentially expressed metabolites, which were presented as a volcano plot. The screening conditions were VIP of ≥1, change of ≥1.2-fold or ≤0.8-fold, and P value of <0.05. The cluster analysis used the pheatmap function in the pheatmap package in R. The cluster data were converted to log2 values before being used in the cluster analysis. Student's t test was used, and corrected P values (q values) of <0.05 were deemed statistically significant.
Metabolite annotation and pathway analysis.
Metabolite identification was performed by matching the exact molecular mass data (m/z) of the samples against METLIN (http://metlin.scripps.edu) and HMDB (http://www.hmdb.ca), with an accuracy of 10 ppm (41, 42). To further increase the confidence in the identification and to reduce the number of false hits, MS/MS spectra for the characteristic ions and fragmentation patterns of the compound were matched against the reference spectra in HMDB, METLIN, and mzcloud (http://www.mzcloud.org) (43). Quantitatively different metabolites were mapped to the reference pathway in the online KEGG database (http://www.genome.jp/kegg). Significantly enriched pathways were assessed on the basis of the false-discovery-rate-adjusted hypergeometric test statistic (P values of ≤0.05).
Data availability.
The metabolomic data have been submitted to the MetaboLights database under accession number MTBLS852. The full data set is also available from Chun-Xue Zhou upon request (zhouchunxue23@163.com).
Supplementary Material
ACKNOWLEDGMENTS
Project support was provided by the Natural Science Foundation of Shandong Province of China (grant ZR2018BH30), the State Key Laboratory of Veterinary Etiological Biology, Lanzhou Veterinary Research Institute, Chinese Academy of Agricultural Sciences (grant SKLVEB2018KFKT009), the Basal Research Fund of Shandong University (grant 2017GN0015), the International Science and Technology Cooperation Project of Gansu Provincial Key Research and Development Program (grant 17JR7WA031), and the Agricultural Science and Technology Innovation Program (grant CAAS-ASTIP-2016-LVRI-03).
We declare that we have no competing interests.
C.-X.Z., H.M.E., and X.-Q.Z. conceived and designed the experiments. C.-X.Z., Y.G., and Q.L. performed the experiments. Y.G., X.-Q.C., H.C., and Q.L. contributed reagents, materials, and/or analysis tools. C.-X.Z. and Y.G. analyzed the data and wrote the paper. H.M.E. and X.-Q.Z. critically revised the manuscript. All authors read and approved the final version of the manuscript.
Footnotes
Supplemental material for this article may be found at https://doi.org/10.1128/AAC.00312-19.
REFERENCES
- 1.Weiss LM, Dubey JP. 2009. Toxoplasmosis: a history of clinical observations. Int J Parasitol 39:895–901. doi: 10.1016/j.ijpara.2009.02.004. [DOI] [PMC free article] [PubMed] [Google Scholar]
- 2.Howe DK, Sibley LD. 1995. Toxoplasma gondii comprises three clonal lineages: correlation of parasite genotype with human disease. J Infect Dis 172:1561–1566. doi: 10.1093/infdis/172.6.1561. [DOI] [PubMed] [Google Scholar]
- 3.Taylor S, Barragan A, Su C, Fux B, Fentress SJ, Tang K, Beatty WL, Hajj HE, Jerome M, Behnke MS, White M, Wootton JC, Sibley LD. 2006. A secreted serine-threonine kinase determines virulence in the eukaryotic pathogen Toxoplasma gondii. Science 314:1776–1780. doi: 10.1126/science.1133643. [DOI] [PubMed] [Google Scholar]
- 4.Tenter AM, Heckeroth AR, Weiss LM. 2000. Toxoplasma gondii: from animals to humans. Int J Parasitol 30:1217–1258. doi: 10.1016/S0020-7519(00)00124-7. [DOI] [PMC free article] [PubMed] [Google Scholar]
- 5.Ferreira MS, Borges AS. 2002. Some aspects of protozoan infections in immunocompromised patients: a review. Mem Inst Oswaldo Cruz 97:443–457. doi: 10.1590/s0074-02762002000400001. [DOI] [PubMed] [Google Scholar]
- 6.Shwab EK, Zhu XQ, Majumdar D, Pena HF, Gennari SM, Dubey JP, Su C. 2014. Geographical patterns of Toxoplasma gondii genetic diversity revealed by multilocus PCR-RFLP genotyping. Parasitology 141:453. doi: 10.1017/S0031182013001844. [DOI] [PubMed] [Google Scholar]
- 7.Mack DG, McLeod R. 1984. New micromethod to study the effect of antimicrobial agents on Toxoplasma gondii: comparison of sulfadoxine and sulfadiazine individually and in combination with pyrimethamine and study of clindamycin, metronidazole, and cyclosporin A. Antimicrob Agents Chemother 26:26–30. doi: 10.1128/AAC.26.1.26. [DOI] [PMC free article] [PubMed] [Google Scholar]
- 8.Doliwa C, Escotte-Binet S, Aubert D, Velard F, Schmid A, Geers R, Villena I. 2013. Induction of sulfadiazine resistance in vitro in Toxoplasma gondii. Exp Parasitol 133:131–136. doi: 10.1016/j.exppara.2012.11.019. [DOI] [PubMed] [Google Scholar]
- 9.Georgiev SV. 1994. Management of toxoplasmosis. Drugs 48:179–188. doi: 10.2165/00003495-199448020-00005. [DOI] [PubMed] [Google Scholar]
- 10.Luft BJ, Remington JS. 1992. Toxoplasmic encephalitis in AIDS. Clin Infect Dis 15:211–222. doi: 10.1093/clinids/15.2.211. [DOI] [PubMed] [Google Scholar]
- 11.Kongsaengdao S, Samintarapanya K, Oranratnachai K, Prapakarn W, Apichartpiyakul C. 2008. Randomized controlled trial of pyrimethamine plus sulfadiazine versus trimethoprim plus sulfamethoxazole for treatment of toxoplasmic encephalitis in AIDS patients. J Int Assoc Physicians AIDS Care (Chic) 7:11–16. doi: 10.1177/1545109707301244. [DOI] [PubMed] [Google Scholar]
- 12.Yamashita H, Takenoshita M, Sakurai M, Bruick RK, Henzel WJ, Shillinglaw W, Arnot D, Uyeda K. 2001. A glucose-responsive transcription factor that regulates carbohydrate metabolism in the liver. Proc Natl Acad Sci U S A 98:9116–9121. doi: 10.1073/pnas.161284298. [DOI] [PMC free article] [PubMed] [Google Scholar]
- 13.Beyoğlu D, Imbeaud S, Maurhofer O, Bioulac-Sage P, Zucman-Rossi J, Dufour JF, Idle JR. 2013. Tissue metabolomics of hepatocellular carcinoma: tumor energy metabolism and the role of transcriptomic classification. Hepatology 58:229–238. doi: 10.1002/hep.26350. [DOI] [PMC free article] [PubMed] [Google Scholar]
- 14.Patterson AD, Maurhofer O, Beyoglu D, Lanz C, Krausz KW, Pabst T, Gonzalez FJ, Dufour JF, Idle JR. 2011. Aberrant lipid metabolism in hepatocellular carcinoma revealed by plasma metabolomics and lipid profiling. Cancer Res 71:6590–6600. doi: 10.1158/0008-5472.CAN-11-0885. [DOI] [PMC free article] [PubMed] [Google Scholar]
- 15.Mihalik SJ, Michaliszyn SF, de las Heras J, Bacha F, Lee S, Chace DH, DeJesus VR, Vockley J, Arslanian SA. 2012. Metabolomic profiling of fatty acid and amino acid metabolism in youth with obesity and type 2 diabetes: evidence for enhanced mitochondrial oxidation. Diabetes Care 35:605–611. doi: 10.2337/DC11-1577. [DOI] [PMC free article] [PubMed] [Google Scholar]
- 16.Chen L, Fan J, Li Y, Shi X, Ju D, Yan Q, Yan X, Han L, Zhu H. 2014. Modified Jiu Wei Qiang Huo decoction improves dysfunctional metabolomics in influenza A pneumonia-infected mice. Biomed Chromatogr 28:468–474. doi: 10.1002/bmc.3055. [DOI] [PubMed] [Google Scholar]
- 17.Kim KB, Yang JY, Kwack SJ, Kim HS, Ryu DH, Kim YJ, Bae JY, Lim DS, Choi SM, Kwon MJ, Bang DY, Lim SK, Kim YW, Hwang GS, Lee BM. 2013. Potential metabolomic biomarkers for evaluation of Adriamycin efficacy using a urinary 1H-NMR spectroscopy. J Appl Toxicol 33:1251–1259. doi: 10.1002/jat.2778. [DOI] [PubMed] [Google Scholar]
- 18.Gika HG, Theodoridis GA, Plumb RS, Wilson ID. 2014. Current practice of liquid chromatography-mass spectrometry in metabolomics and metabonomics. J Pharm Biomed Anal 87:12–25. doi: 10.1016/j.jpba.2013.06.032. [DOI] [PubMed] [Google Scholar]
- 19.Yin P, Xu G. 2014. Current state-of-the-art of nontargeted metabolomics based on liquid chromatography-mass spectrometry with special emphasis in clinical applications. J Chromatogr A 1374:1–13. doi: 10.1016/j.chroma.2014.11.050. [DOI] [PubMed] [Google Scholar]
- 20.Theodoridis G, Gika HG, Wilson ID. 2011. Mass spectrometry-based holistic analytical approaches for metabolite profiling in systems biology studies. Mass Spectrom Rev 30:884–906. doi: 10.1002/mas.20306. [DOI] [PubMed] [Google Scholar]
- 21.Want EJ, Wilson ID, Gika H, Theodoridis G, Plumb RS, Shockcor J, Holmes E, Nicholson JK. 2010. Global metabolic profiling procedures for urine using UPLC-MS. Nat Protoc 5:1005–1018. doi: 10.1038/nprot.2010.50. [DOI] [PubMed] [Google Scholar]
- 22.Zhou CX, Cong W, Chen XQ, He SY, Elsheikha HM, Zhu XQ. 2017. Serum metabolic profiling of oocyst-induced Toxoplasma gondii acute and chronic infections in mice using mass-spectrometry. Front Microbiol 8:2612. doi: 10.3389/fmicb.2017.02612. [DOI] [PMC free article] [PubMed] [Google Scholar]
- 23.Farooqui AA, Horrocks LA, Farooqui T. 2000. Glycerophospholipids in brain: their metabolism, incorporation into membranes, functions, and involvement in neurological disorders. Chem Phys Lipids 106:1–29. doi: 10.1016/S0009-3084(00)00128-6. [DOI] [PubMed] [Google Scholar]
- 24.Wenk MR. 2010. Lipidomics: new tools and applications. Cell 143:888–895. doi: 10.1016/j.cell.2010.11.033. [DOI] [PubMed] [Google Scholar]
- 25.Fox BA, Gigley JP, Bzik DJ. 2004. Toxoplasma gondii lacks the enzymes required for de novo arginine biosynthesis and arginine starvation triggers cyst formation. Int J Parasitol 34:323–331. doi: 10.1016/j.ijpara.2003.12.001. [DOI] [PubMed] [Google Scholar]
- 26.Weiss LM, Kim K. 2000. The development and biology of bradyzoites of Toxoplasma gondii. Front Biosci 5:D391–D405. doi: 10.2741/A521. [DOI] [PMC free article] [PubMed] [Google Scholar]
- 27.Han RZ, Xu GC, Dong JJ, Ni Y. 2016. Arginine deiminase: recent advances in discovery, crystal structure, and protein engineering for improved properties as an anti-tumor drug. Appl Microbiol Biotechnol 100:4747–4760. doi: 10.1007/s00253-016-7490-z. [DOI] [PubMed] [Google Scholar]
- 28.Fujigaki S, Saito K, Takemura M, Maekawa N, Yamada Y, Wada H, Seishima M. 2002. l-Tryptophan-l-kynurenine pathway metabolism accelerated by Toxoplasma gondii infection is abolished in gamma interferon-gene-deficient mice: cross-regulation between inducible nitric oxide synthase and indoleamine-2,3-dioxygenase. Infect Immun 70:779–786. doi: 10.1128/IAI.70.2.779-786.2002. [DOI] [PMC free article] [PubMed] [Google Scholar]
- 29.Murakami Y, Hoshi M, Hara A, Takemura M, Arioka Y, Yamamoto Y, Matsunami H, Funato T, Seishima M, Saito K. 2012. Inhibition of increased indoleamine 2,3-dioxygenase activity attenuates Toxoplasma gondii replication in the lung during acute infection. Cytokine 59:245–251. doi: 10.1016/j.cyto.2012.04.022. [DOI] [PubMed] [Google Scholar]
- 30.Mezrich JD, Fechner JH, Zhang XJ, Johnson BP, Burlingham WJ, Bradfield CA. 2010. An interaction between kynurenine and the aryl hydrocarbon receptor can generate regulatory T cells. J Immunol 185:3190–3198. doi: 10.4049/jimmunol.0903670. [DOI] [PMC free article] [PubMed] [Google Scholar]
- 31.Burdge GC. 2006. Metabolism of α-linolenic acid in humans. Prostaglandins Leukot Essent Fatty Acids 75:161–168. doi: 10.1016/j.plefa.2006.05.013. [DOI] [PubMed] [Google Scholar]
- 32.Wohlt JE, Clark JH, Derrig RG, Davis CL. 1977. Valine, leucine, and isoleucine metabolism by lactating bovine mammary tissue. J Dairy Sci 60:1875–1882. doi: 10.3168/jds.S0022-0302(77)84118-0. [DOI] [PubMed] [Google Scholar]
- 33.Peters JC. 1991. Tryptophan nutrition and metabolism: an overview. Adv Exp Med Biol 294:345–358. doi: 10.1007/978-1-4684-5952-4_32. [DOI] [PubMed] [Google Scholar]
- 34.Mordue DG, Sibley LD. 1997. Intracellular fate of vacuoles containing Toxoplasma gondii is determined at the time of formation and depends on the mechanism of entry. J Immunol 159:4452–4459. [PubMed] [Google Scholar]
- 35.Zeng YB, Zhu SH, Dong H, Han HY, Jiang LL, Wang Q, Cheng J, Zhao QP, Ma WJ, Huang B. 2012. Great efficacy of sulfachloropyrazine-sodium against acute murine toxoplasmosis. Asian Pac J Trop Biomed 2:70–75. doi: 10.1016/S2221-1691(11)60193-7. [DOI] [PMC free article] [PubMed] [Google Scholar]
- 36.Wikoff WR, Anfora AT, Liu J, Schultz PG, Lesley SA, Peters EC, Siuzdak G. 2009. Metabolomics analysis reveals large effects of gut microflora on mammalian blood metabolites. Proc Natl Acad Sci U S A 106:3698–3703. doi: 10.1073/pnas.0812874106. [DOI] [PMC free article] [PubMed] [Google Scholar]
- 37.Wen B, Mei Z, Zeng C, Liu S. 2017. metaX: a flexible and comprehensive software for processing metabolomics data. BMC Bioinformatics 18:183. doi: 10.1186/s12859-017-1579-y. [DOI] [PMC free article] [PubMed] [Google Scholar]
- 38.Rousseau R, Govaerts B, Verleysen M, Boulanger B. 2008. Comparison of some chemometric tools for metabonomics biomarker identification. Chemom Intell Lab Syst 91:54–66. doi: 10.1016/j.chemolab.2007.06.008. [DOI] [Google Scholar]
- 39.Lee KR, Lin X, Park DC, Eslava S. 2003. Megavariate data analysis of mass spectrometric proteomics data using latent variable projection method. Proteomics 3:1680–1686. doi: 10.1002/pmic.200300515. [DOI] [PubMed] [Google Scholar]
- 40.Westerhuis JA, Hoefsloot HCJ, Smit S, Vis DJ, Smilde AK, Velzen E, Duijnhoven J, Dorsten F. 2008. Assessment of PLSDA cross validation. Metabolomics 4:81–89. doi: 10.1007/s11306-007-0099-6. [DOI] [Google Scholar]
- 41.Smith CA, O'Maille G, Want EJ, Qin C, Trauger SA, Brandon TR, Custodio DE, Abagyan R, Siuzdak G. 2005. METLIN: a metabolite mass spectral database. Ther Drug Monit 27:747–751. doi: 10.1097/01.ftd.0000179845.53213.39. [DOI] [PubMed] [Google Scholar]
- 42.Wishart DS, Tzur D, Knox C, Eisner R, Guo AC, Young N, Cheng D, Jewell K, Arndt D, Sawhney S, Fung C, Nikolai L, Lewis M, Coutouly MA, Forsythe I, Tang P, Shrivastava S, Jeroncic K, Stothard P, Amegbey G, Block D, Hau DD, Wagner J, Miniaci J, Clements M, Gebremedhin M, Guo N, Zhang Y, Duggan GE, Macinnis GD, Weljie AM, Dowlatabadi R, Bamforth F, Clive D, Greiner R, Li L, Marrie T, Sykes BD, Vogel HJ, Querengesser L. 2007. HMDB: the Human Metabolome Database. Nucleic Acids Res 35:D521–D526. doi: 10.1093/nar/gkl923. [DOI] [PMC free article] [PubMed] [Google Scholar]
- 43.Mistrik R, Lutisan J, Huang Y, Suchy M, Wang J, Raab M. 2013. mzCloud: a key conceptual shift to understand ‘who’s who’ in untargeted metabolomics, abstr P9-55 In 9th Annual Conference of the Metabolomics Society: full abstracts. Metabolomics Society, Boston, MA: https://www.researchgate.net/profile/Utpal_Bose/publication/260843700_Patterns_of_chemical_diversity_on_sponge_associated_marine_bacteria/links/02e7e532aa87914a8b000000/Patterns-of-chemical-diversity-on-sponge-associated-marine-bacteria.pdf. [Google Scholar]
Associated Data
This section collects any data citations, data availability statements, or supplementary materials included in this article.
Supplementary Materials
Data Availability Statement
The metabolomic data have been submitted to the MetaboLights database under accession number MTBLS852. The full data set is also available from Chun-Xue Zhou upon request (zhouchunxue23@163.com).


