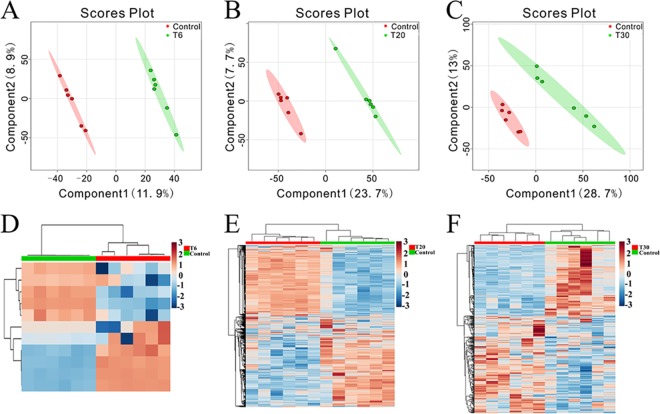
FIG 3.
Discrimination between treated and control mice based on ESI+-mode-derived metabolic phenotypes of serum. (A to C) PLS-DA score plots for the T6 group versus the control group (A), the T20 group versus the control group (B), and the T30 group versus the control group (C). (D to F) Heatmaps of the differential metabolites for the T6 group versus the control group (D), the T20 group versus the control group (E), and the T30 group versus the control group (F).

