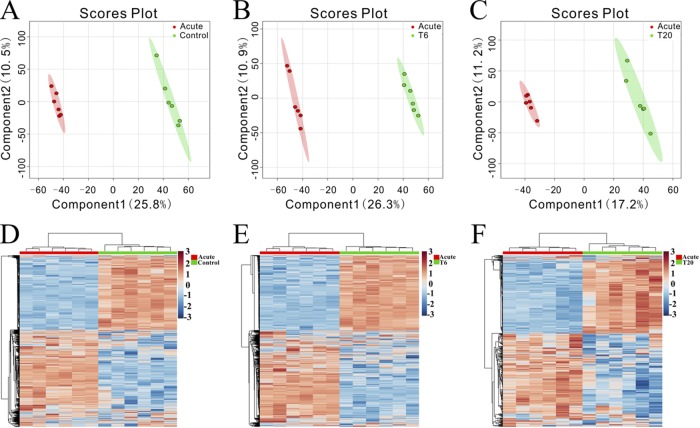
FIG 4.
Discrimination between the control group, the T6 group, and the T20 group versus acutely infected (acute) mice based on ESI+-mode-derived serum metabolic profiles. (A to C) PLS-DA score plots for control versus acutely infected mice (A), the T6 group versus acutely infected mice (B), and the T20 group versus acutely infected mice (C). (D to F) Heatmaps of the top differential metabolites for control versus acutely infected mice (D), the T6 group versus acutely infected mice (E), and the T20 group versus acutely infected mice (F).

