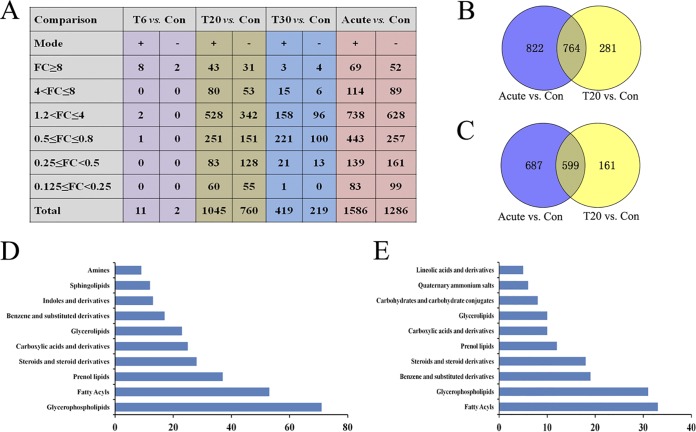
FIG 5.
Global view of the temporal metabolic expression profiles during SDZ treatment. (A) Statistics for differentially expressed metabolites among samples. FC, fold change; Con, control. (B and C) Venn diagram analysis of differentially abundant metabolites between SDZ-treated (T20) and untreated acutely infected mice versus control (PBS-treated) mice. The numbers in the overlapping part of the circles represent common differentially abundant metabolites between the mouse groups in the ESI+ mode (B) and ESI– mode (C). (D) Top 10 enriched metabolite classes common for the acute group versus the control group and the T20 group versus the control group in ESI+ mode. (E) Top 10 enriched metabolite classes common for the acute group versus the control group and the T20 group versus the control group in ESI− mode. The x axis represents the number of metabolites for the chemical classes mentioned on the y axis.

