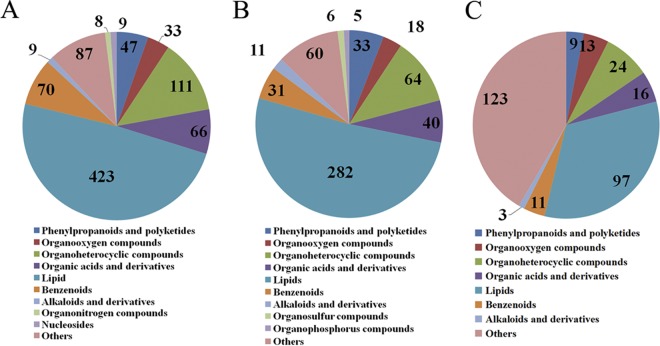
FIG 6.
Summary statistics for the annotated differential metabolites identified among different groups in ESI+ mode. (A) Ten largest categories for mice in the acute infection group versus the control group. (B) Ten largest categories for the T6 group versus the control group. (C) Eight largest categories for the T30 group versus the control group. The numbers in the Venn diagrams represent the numbers of the annotated differential metabolites.

