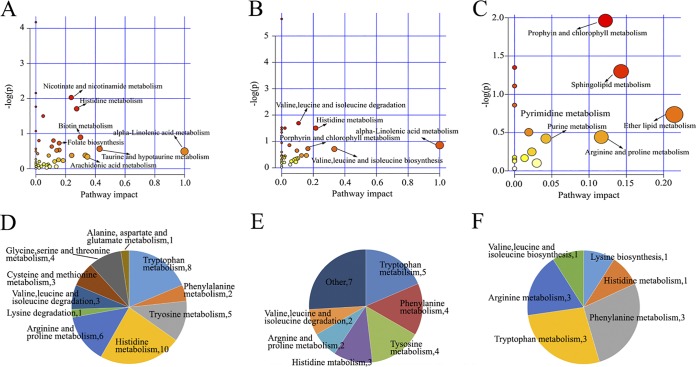
FIG 8.
Perturbed metabolic pathways in T. gondii infection and SDZ treatment. (A to C) Pathway impacts resulting from the differential metabolites determined using MetaboAnalyst 3.0. Small P values and high pathway impact factors indicate that the pathway is greatly influenced. (A) Acute group versus the control group. (B) T20 group versus the control group. (C) T30 group versus the control group. (D to F) Distribution of differential metabolites involved in amino acid metabolism. (D) Acute group versus the control group. (E) T20 group versus the control group. (F) T30 group versus the control group. The numbers in the Venn diagrams represent the numbers of the differential metabolites involved in amino acid metabolism.

