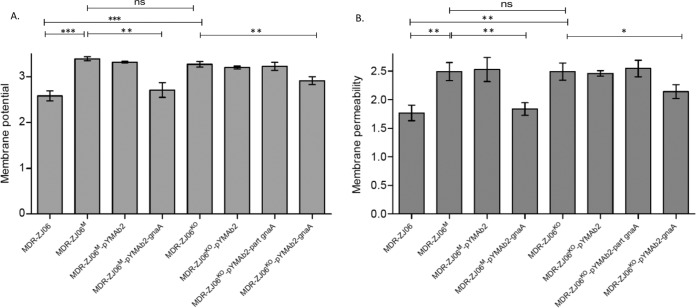
FIG 2.
Membrane potential and membrane permeability assay. Each strain was tested in triplicate, and the data were calculated based on three independent experiments. A normalized permeability parameter from the ratio of To-Pro-3 fluorescence to green DiOC2(3) fluorescence was derived. The mean ± standard deviation (SD) is shown; the mean differences were analyzed using Student’s t test. *, P < 0.05; **, P < 0.01; ***, P < 0.001.

