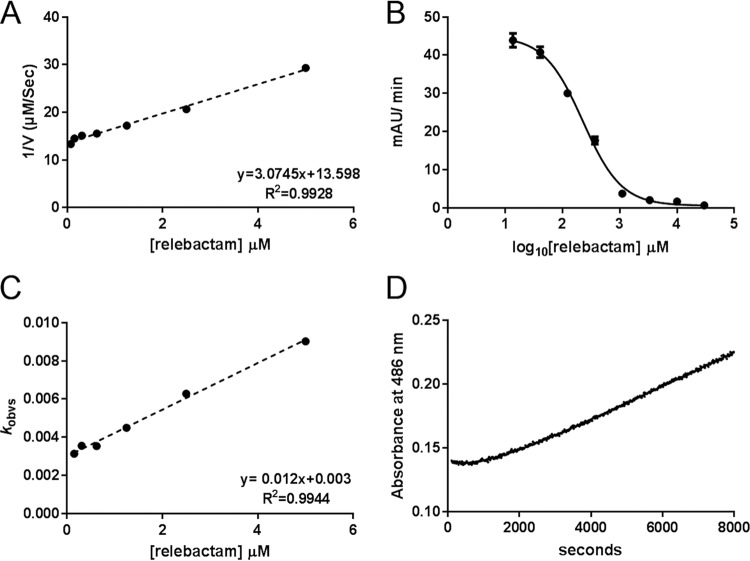
FIG 2.
Kinetic characterization of relebactam inhibition of KPC-2. (A) Dixon plot of reciprocals of initial nitrocefin hydrolysis rates (1/V) by enzyme:relebactam mixtures plotted against relebactam concentration. The apparent inhibition constant Kiapp is obtained from the slope of the fitted straight line. (B) Initial rates of nitrocefin hydrolysis (absorbance units/min) after 10-minute incubation with relebactam, plotted against log10 [relebactam]. Fitted curve is used to derive IC50 according to equation 1. (C) Plot of kobs (pseudo-first-order rate constant for inactivation) against relebactam concentration. The apparent second-order rate constant for the onset of carbamylation k2/K is obtained from the slope of the fitted straight line. (D) Progress curve representing recovery of nitrocefin hydrolysis following 10-minute preincubation of enzyme (1 μM) with 17.5 μM relebactam, diluted to a final concentration of 50 nM enzyme. The rate of recovery of free enzyme, koff, is obtained from the fitted line shown according to equation 8. Data points shown are means of three replicate runs.

