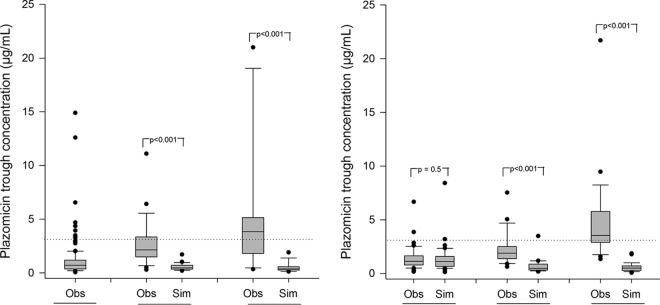
FIG 1.
Median observed (obs) versus simulated (sim) plazomicin trough concentrations according to Hartford nomogram dosing eligibility among patients with (left) CLcr of ≥60 ml/min and (right) CLcr of >30 to 59 ml/min. Boxes represent the median and 25th and 75th percentiles. Whiskers represent the 5th and 95th percentiles. Data points (dots) represent individual concentration outliers. The dashed line represents the toxicity threshold (3 μg/ml).

