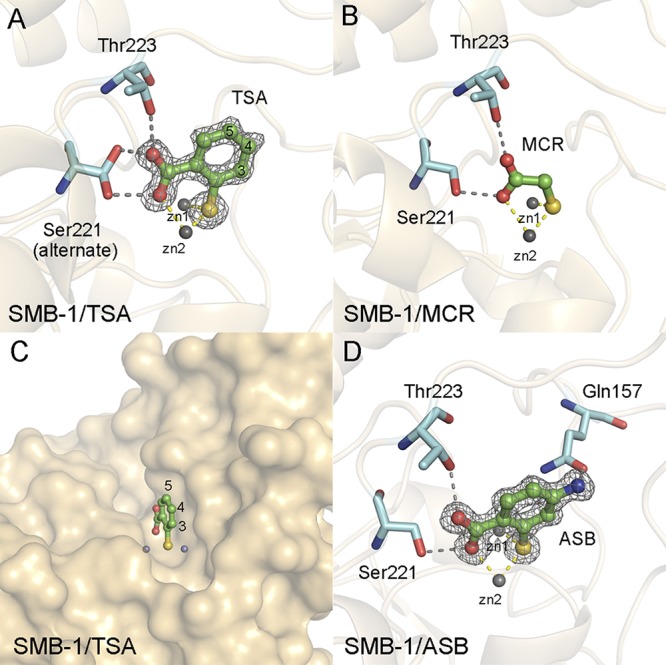
FIG 1.

(A) Schematic representation of the SMB-1 structure in complex with TSA. A |Fo|-|Fc| omit map of TSA contoured at 3.0 σ (gray mesh) is shown. TSA is depicted using green (carbon), red (oxygen), and yellow (sulfur) sticks. Amino acids Ser221 and Thr223 of SMB-1 are shown as cyan sticks. Zinc ions are illustrated as gray spheres. Gray and yellow dashed lines indicate hydrogen and coordination bonds, respectively. (B) Interactions between SMB-1 and MCR. The color code is the same as that described for panel A. The figure was constructed based on PDB data (PDB ID 3VQZ). (C) Surface representation of the structure of SMB-1 in complex with TSA (shown in ochre). (D) Interactions between SMB-1 and ASB. |Fo|-|Fc| omit maps of ASB contoured at 3.0 σ (gray mesh) are shown. ASB is shown in green sticks. The other molecules follow the color code described for panel A.
