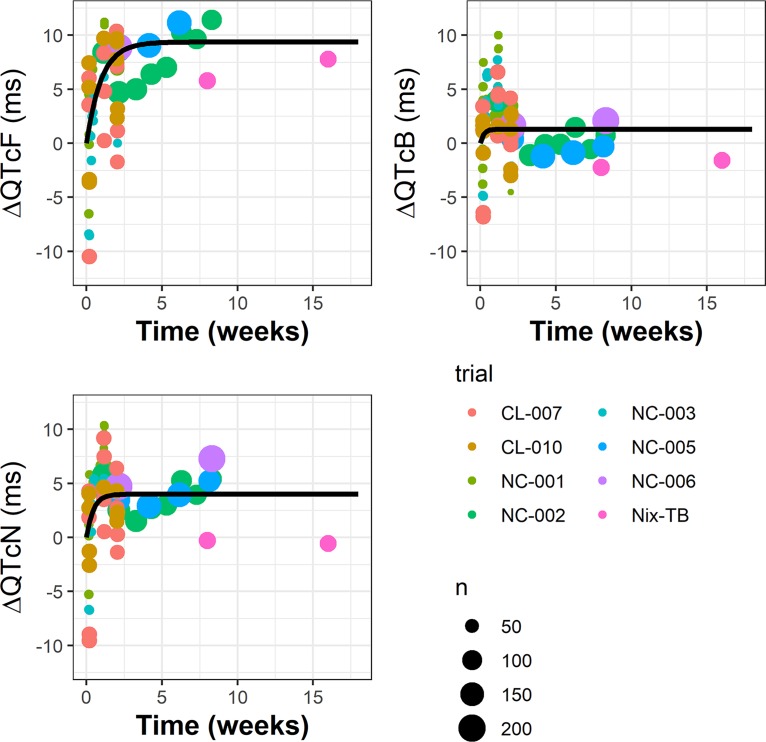
FIG 3.
Estimated intercepts versus study week and the secular trend for QTcN, QTcF, and QTcB. Points represent the mean intercepts estimated for each study, visit, and time postdose at median baseline QTc, and the size of the points indicates the cohort size. Black curves represent the fitted secular trend model, Ew = Pmax (1 – e–λw), where Pmax is the steady-state value and log(2)/λ is the half-life for the approach to steady state.

