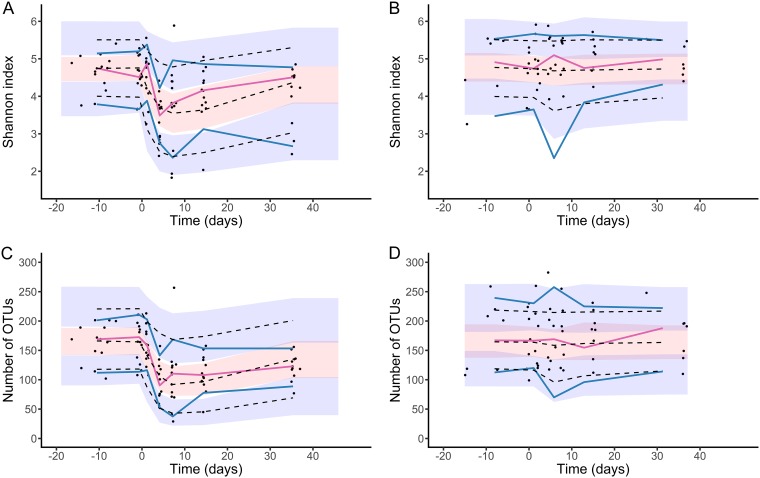
FIG 3.
Visual predictive checks for pharmacodynamic model. The Shannon index is depicted for (A) moxifloxacin-treated subjects and (B) untreated subjects, and the number of OTUs is depicted for (C) moxifloxacin-treated subjects and (D) untreated subjects. Blue and red lines indicate the observed percentiles (10th, 50th, and 90th percentiles); blue and red ribbons indicate the corresponding 95% confidence intervals. The dashed black lines indicate predicted percentiles. Black points indicate the individual observations.

