FIG 2.
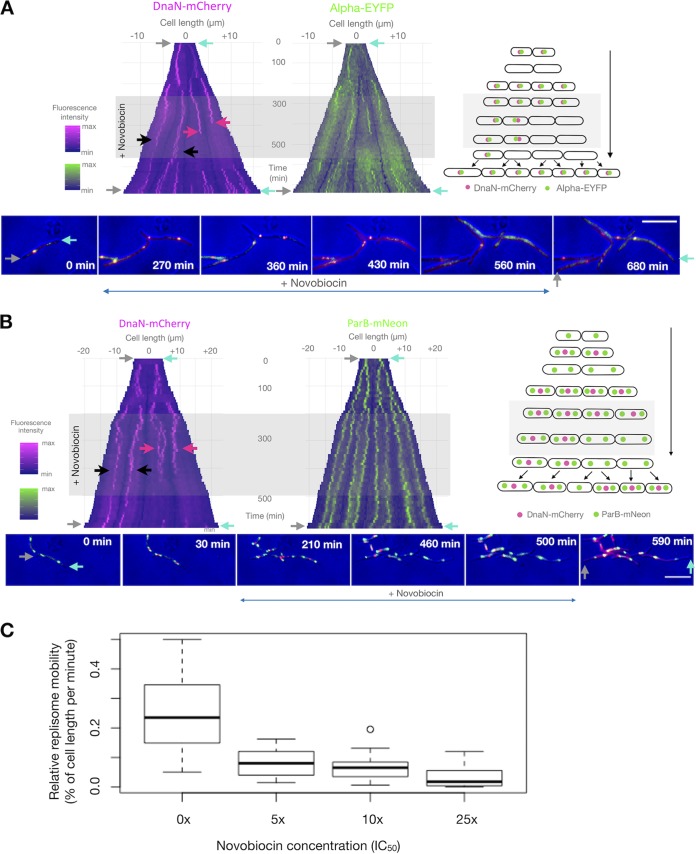
Novobiocin stalls replisomes but has only a moderate effect on growth in M. smegmatis cells. (A and B) Kymographs of representative cells of two M. smegmatis strains exposed to novobiocin: DnaN-mCherry/Alpha-EYFP (A) and DnaN-mCherry/ParB-mNeon (B). The left kymographs show the DnaN-mCherry fluorescence over time (A and B), while the right ones present the Alpha-EYFP (A) or ParB-mNeon (B) fluorescence over time. Time-lapse images of the cells depicted on the kymographs are presented at the bottom, and schematic graphs of the analyzed cells are presented on the right. Antibiotic treatment is indicated by gray rectangles; black arrows mark cells in which replication proceeds in the presence of novobiocin; red arrows mark cells in which replication terminates during novobiocin treatment; gray and cyan arrows indicate the corresponding poles on both images and kymographs. Bars, 5 μm. (C) Dose-dependent inhibition of replisome mobility during novobiocin exposure of DnaN-mCherry/ParB-mNeon cells. The box plots represent replisome mobility (defined as the relative distance that a replisome traveled along the cell per minute) under increasing concentrations of novobiocin (0×, 5×, 10×, and 25× IC50; n = 20 for each concentration). Measurements were performed from the old pole.

