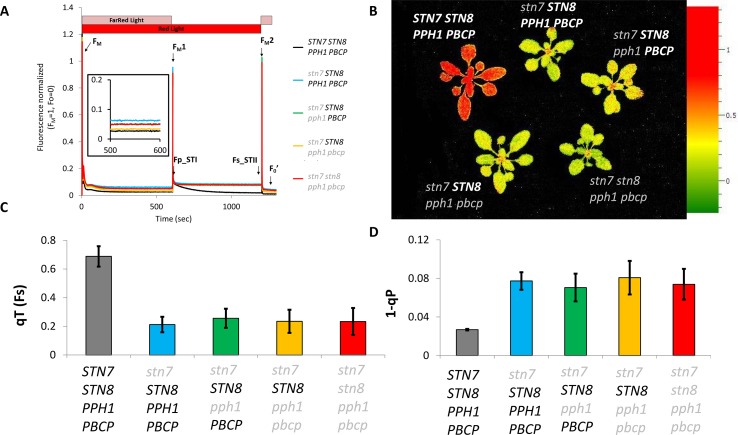
Figure 4.
State transitions in stn7 and multiple mutants. (A) The kinetics of state transitions were analyzed by continuously monitoring chlorophyll fluorescence with a FluorCam (MF800 PSI - PhotoSystems Instruments). After a preincubation of 30 min in darkness, actinic red light (represented as a red bar) and far-red light (represented as a pink bar) were turned on for 10 min to induce state 1 before maximal fluorescence (FM1) was measured with a 300ms saturating flash. Far-red light was then turned off for 10 min to induce a transition from state 1 to state 2, and maximal fluorescence (FM2) was again measured with a saturating flash. The curves (normalized to average FM = 1, F0 = 0) are the average of three replicates of the protocol on a set of adult plants (4 weeks) of each genotype. F0’ is the minimal fluorescence measured in the dark after the light treatment. F0 was measured shortly before FM and is not visible in the graph. (B) Heat map of the state transition measured in terms of variation of the fluorescence at the beginning (Fp_STI) and the end (Fs_STII) of the state 1 to state 2 transition. The two timepoints are marked in panel A with arrows, the scale represents the calculated value of qT(Fs) for every measured pixel which corresponds to (Fp_STI-Fs_STII)/Fs_STII. (C) Average value and standard deviation of the qT(Fs) parameter for the analyzed genotypes. (D) Average value and standard deviation of the 1-qP parameter representing the excitation pressure on PSII measured at the end of the red light phase (State II).

