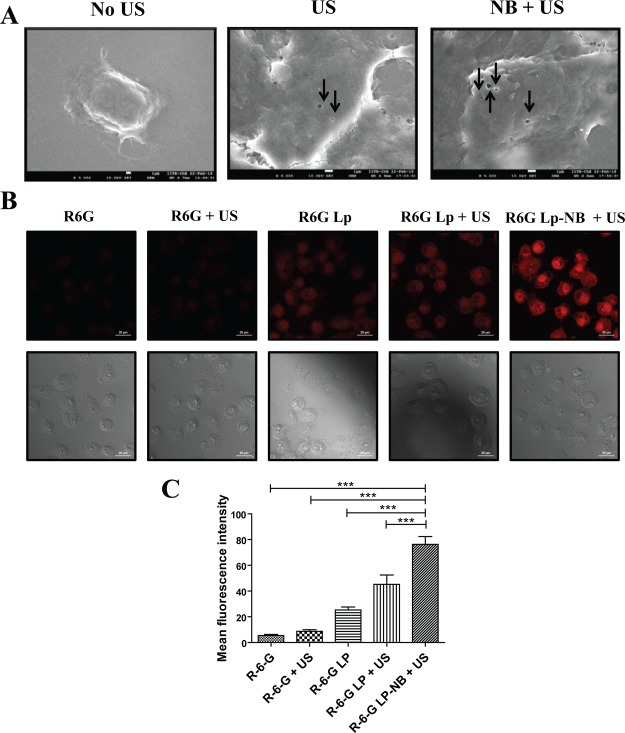
Figure 11.
[A] Scanning electron micrograph of MiaPaca-2 cells untreated, US treated, and NB + US treated (scale bar—1 μm). Arrows indicate the sonopore formation on the cell membrane of MiaPaca-2 cells. [B] Confocal laser scanning microscope images (fluorescence and differential interference contrast) of MiaPaca-2 cells treated with R6G, R6G + US, R6G Lp, R6G-Lp + US, and NB-R6G-Lp + US. (scale bar—20 μm). [C] Fluorescence intensity analysis of MiaPaca-2 cells treated with R6G, R6G + US, R6G Lp, R6G-Lp + US, and NB-R6G-Lp + US (***p < 0.001).

