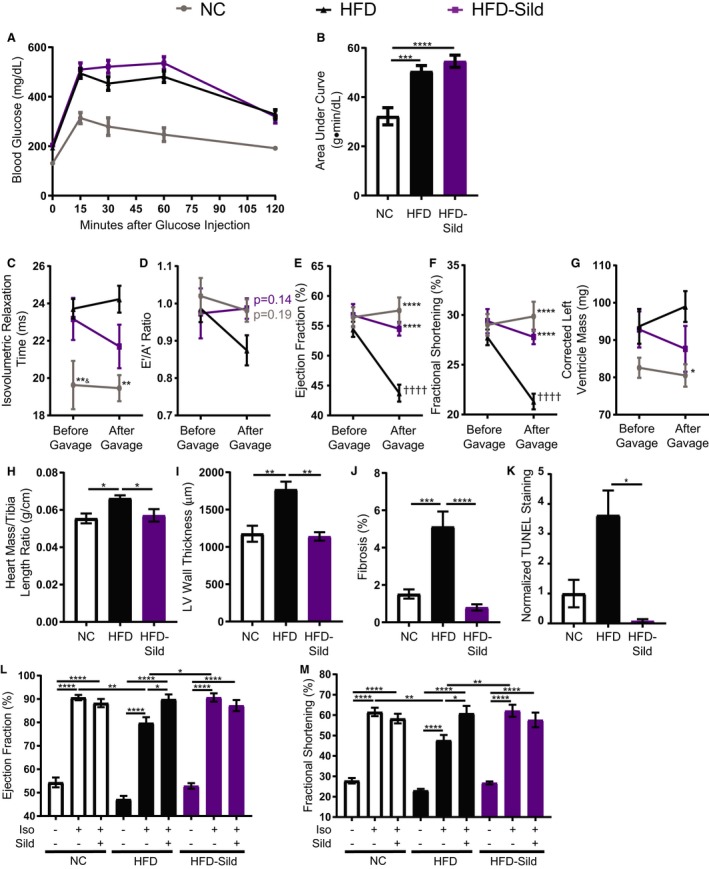
Figure 1.

Sustained in vivo sildenafil treatment in mice fed a high fat diet (HFD) improves basal and adrenergic‐induced heart function and morphology. A, Intraperitoneal glucose tolerance testing (IPGTT) and (B) area under the curve of IPGTT from wild‐type (WT) mice on a special diet for 4.5 months and gavaged for 1 month with either vehicle or 100 mg/kg per day of sildenafil citrate. ***P≤0.001, ****P≤0.0001 by 1‐way ANOVA and Tukey post‐test. n≥9 mice per group. C, Isovolumetric relaxation time, (D) E’/A’ ratio, (E) ejection fraction, (F) fractional shortening, and (G) corrected left ventricular (LV) mass of WT mice after 3.5 and 4.5 months of normal chow or HFD, as measured by M‐mode and tissue Doppler echocardiogram. Between the 2 readings, all mice were gavaged daily with either vehicle only or 100 mg/kg sildenafil. *P≤0.05, **P≤0.01, ***P≤0.001, ****P≤0.0001 compared with HFD at the same time point; & P≤0.05 compared with HFD‐sildenafil at the same time point; †††† P≤0.0001 compared with the same group before gavage by a repeated measures ANOVA and Sidak post‐test. n≥9 mice per group. H, Heart mass to tibia length ratio of gavaged mice. n=5 mice per group. *P≤0.05 by 1‐way ANOVA and Tukey post‐test. (I) Quantification of LV wall thickness of gavaged mice measured from hematoxylin and eosin slices. n=5 mice per group. **P≤0.01 by 1‐way ANOVA and Tukey post‐test. J, Quantification of fibrosis percentage in gavaged mice, measured from 6 areas of each mouse left ventricle stained with Masson's trichome. n=5 mice per group. ***P≤0.001, ****P≤0.0001 by 1‐way ANOVA and Tukey post‐test. K, Quantification of terminal deoxynucleotidyl transferase dUTP nick‐end labeling (TUNEL)–positive cells in heart slices from gavaged mice. *P≤0.05 by Kruskal–Wallis test with Dunn's post‐test. n=3 mice per group. L, Ejection fraction and (M) fractional shortening of HFD mice gavaged with sildenafil (HFD‐sildenafil) or vehicle only (HFD) at baseline and after isoproterenol followed by sildenafil injections. n≥9 mice per group. *P≤0.05, **P≤0.01, ***P≤0.001, and ****P≤0.0001 by 1‐way ANOVA and Tukey post‐test.
