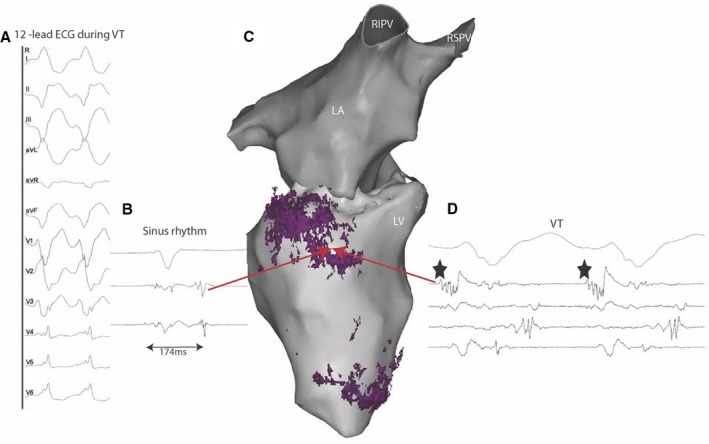
Figure 5.

Registration of fat distribution on electro‐anatomical mapping data. Sixty‐one‐year‐old man with history of prior myocardial infarction in right coronary artery and distal left anterior descending artery territories. The 12‐lead recording of his clinical VT indicated an infero‐septal exit (A). The distribution of fat assessed on CT was registered on the electro‐anatomical geometry (C, inferior view of left chambers with fat deposition shown in purple). During sinus rhythm, late potentials were identified on the basal fatty area (B, red arrow in C). During VT, the same fat site hosted the exit part of the VT circuit (black stars in D). LA indicates left atrial; RIPV, right inferior pulmonary vein; RSPV, right superior pulmonary vein; VT, ventricular tachycardia.
