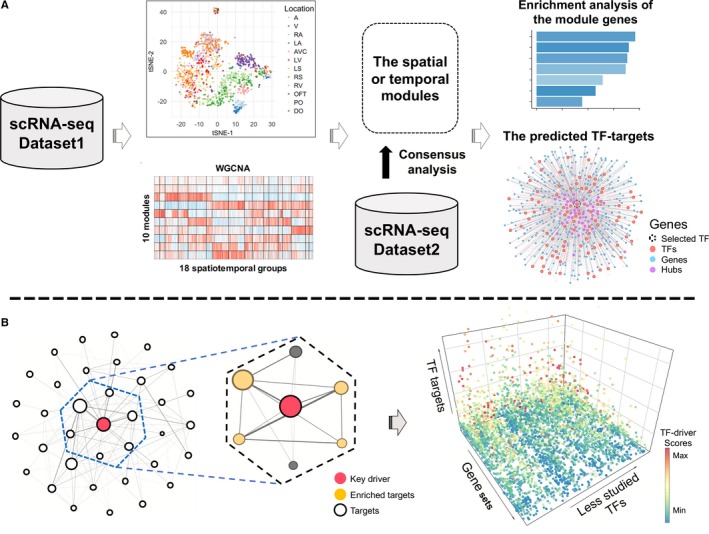
Figure 1.

Workflow for inferring transcription factor (TF)‐target regulatory network. A, Overview of our approach for identifying and characterizing gene co‐expression patterns in cardiomyocytes. The t‐distributed stochastic neighbor embedding (tSNE) map indicates the gene expression similarity among cardiomyocytes, while the weighted gene co‐expression network analysis (WGCNA) heatmap shows co‐expression patterns of genes across cardiomyocytes in different spatial or temporal subgroups. The plot for the predicted TF targets display a TF (dash circle) and its targets that are in the same gene module, with colors for different types of module genes. B, Schematic illustration of function analysis for TF targets. Left panel shows that the potential functional roles of a TF could be predicted by enrichment analysis of its targets, with the dashed box highlighting targets of a TF (red). Right panel shows the enrichment results from the analysis of targets for less‐studied TFs, with colors for TF‐driver scores that quantify the potential regulatory effects of a TF on individual gene sets. See Methods for details. A indicates atrium; AVC, atrioventricular canal; DO, distal outflow tract; LA, left atrium; LS, left ventricular septum; LV, left ventricle; OFT, outflow tract; PO, proximal outflow tract; RA, right atrium; RS, right ventricular septum; RV, right ventricle.
