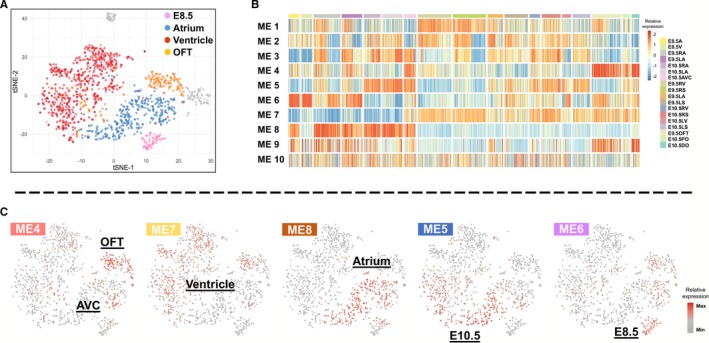
Figure 2.

Identification of gene expression patterns for cardiomyocytes at different anatomical location or developmental stage. A, The t‐SNE map of the cardiomyocytes in data set 1. B, Ten gene modules generated by WGCNA (weighted gene co‐expression network analysis). Columns of the heatmap represent individual cardiomyocyte cells, grouped by their anatomical and developmental stage origins, while each row is a gene module, with heat‐map colors indicating the relative expression of its eigengene. C, Module eigengene patterns at t‐SNE map of cardiomyocyte cells, with colors for module eigengene expressions. AVC indicates atrioventricular canal; OFT, outflow tract; t‐SNE, t‐distributed stochastic neighbor embedding.
