Figure 3.

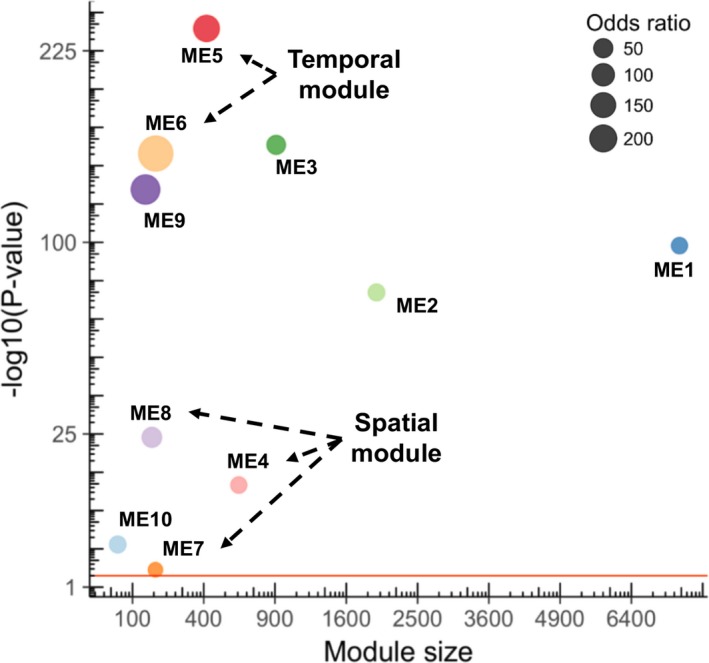
Preservation analysis of the weighted gene co‐expression network analysis modules. The dot size indicates the odds ratio and the y‐axis shows the significance. The red line indicates the threshold (P<0.05) for significant preservation.

Preservation analysis of the weighted gene co‐expression network analysis modules. The dot size indicates the odds ratio and the y‐axis shows the significance. The red line indicates the threshold (P<0.05) for significant preservation.